Stock Analysis · Public Service Enterprise Group Inc (PEG)
Overview
Public Service Enterprise Group Inc. is a large regulated utility company based in New Jersey. Through its main subsidiary, Public Service Electric and Gas, it delivers electricity and natural gas to homes and businesses. It also owns a power generation business, primarily focused on nuclear generation, along with some solar and energy-related assets. For long-term analysis, the key point is that most of PEG’s business is tied to essential services with regulated returns, while a smaller but still important part depends on wholesale power markets and clean-energy production.
The company’s revenue mix can move from year to year because electricity and gas supply costs are often passed through to customers, and generation revenue depends on power prices and output. Using the latest annual business mix and recent filings as a guide, the company’s main revenue sources can be summarized as follows:
- Electric transmission and distribution, and gas distribution: approximately 60% to 70% of total revenue. This includes the regulated delivery of electricity and natural gas, as well as energy efficiency and infrastructure programs approved by regulators.
- Power generation: approximately 25% to 35% of total revenue. This mainly comes from nuclear generation sales into wholesale electricity markets, plus capacity payments and related energy products.
- Other activities: generally less than 10% of total revenue. This can include solar-related activity, energy services, and smaller corporate items.
What matters most is not just sales volume, but how earnings are produced. PEG’s regulated utility is the core profit engine because it earns an allowed return on large capital investments in the grid and gas network. The generation business adds upside when plant performance is strong and power prices are supportive, but it can also make results more variable than those of a pure wires-and-pipes utility.
The long-term operating picture has improved from the weakness seen several years ago. Revenue has recovered and profitability is clearly stronger than in the earlier part of the period shown, even though yearly results still fluctuate with energy markets, weather, and accounting effects.
The business mix shows a company with a stable regulated base and a meaningful generation arm. That combination can produce better earnings than a fully regulated utility during favorable periods, but it also introduces more moving parts than investors see in simpler peers.
Key Figures
| Metric | Value | Sector ⓘ |
|---|---|---|
| Date | Oct 17, 2026 | |
| Context | ||
| Sector | Utilities | |
| Industry | Utilities - Regulated Electric | |
| Market Cap ⓘ | $35.12B | |
| Beta ⓘ | 0.52 | |
Value (Cheapness) | ||
| P/E Ratio ⓘ | 17.53 | 17.28 |
| P/B Ratio ⓘ | 2.04 | 1.51 |
| FCF Yield ⓘ | 5.65% | 0.65% |
| Dividend Yield ⓘ | 3.67% | 3.77% |
| EBIT / EV ⓘ | 5.23% | 5.01% |
| PEG ⓘ | 3.27 | |
Growth (Business expansion) | ||
| Revenue Growth ⓘ | -8.90% | 6.10% |
| RPS Growth (5Y CAGR) ⓘ | 5.93% | 3.87% |
| EPS Growth (5Y CAGR) ⓘ | -9.27% | -11.30% |
| BVPS Growth (5Y CAGR) ⓘ | 4.30% | 4.23% |
| Margin Growth (5Y Trend) ⓘ | 33.83% | 3.57% |
| FCF Growth (5Y CAGR) ⓘ | N/A | -8.84% |
| DPS Growth (5Y CAGR) ⓘ | 5.26% | 4.84% |
Quality (Business durability) | ||
| ROIC (Latest) ⓘ | 6.66% | 6.53% |
| ROA (Latest) ⓘ | 3.48% | 3.20% |
| ROIC (5Y Median) ⓘ | 6.95% | 5.95% |
| ROA (5Y Median) ⓘ | 3.36% | 2.75% |
| Net Debt / EBIT (Latest) ⓘ | 7.94 | 7.13 |
| Net Debt / EBIT (5Y Median) ⓘ | 7.86 | 7.23 |
| Net Debt / EBITDA (Latest) ⓘ | 5.48 | 4.31 |
| Net Debt / Assets ⓘ | 41.63% | 38.42% |
| EBITDA / Interest ⓘ | 4.31 | 4.58 |
| Operating Margin (Latest) ⓘ | 24.58% | 20.83% |
| Operating Margin (5Y Median) ⓘ | 25.91% | 20.08% |
| Debt to Equity (Latest) ⓘ | 142.41% | 137.69% |
| Profit Margin (Latest) ⓘ | 16.04% | 11.37% |
| Free Cash Flow (Latest) ⓘ | $1.99B | |
Momentum (Price trend) | ||
| 3Y Return ⓘ | +28.04% | +52.37% |
| 12M Return (excl. last month) ⓘ | -11.29% | +8.84% |
| 6M Return ⓘ | -12.47% | -3.95% |
| Price vs. 200-Day MA ⓘ | -8.76% | -0.79% |
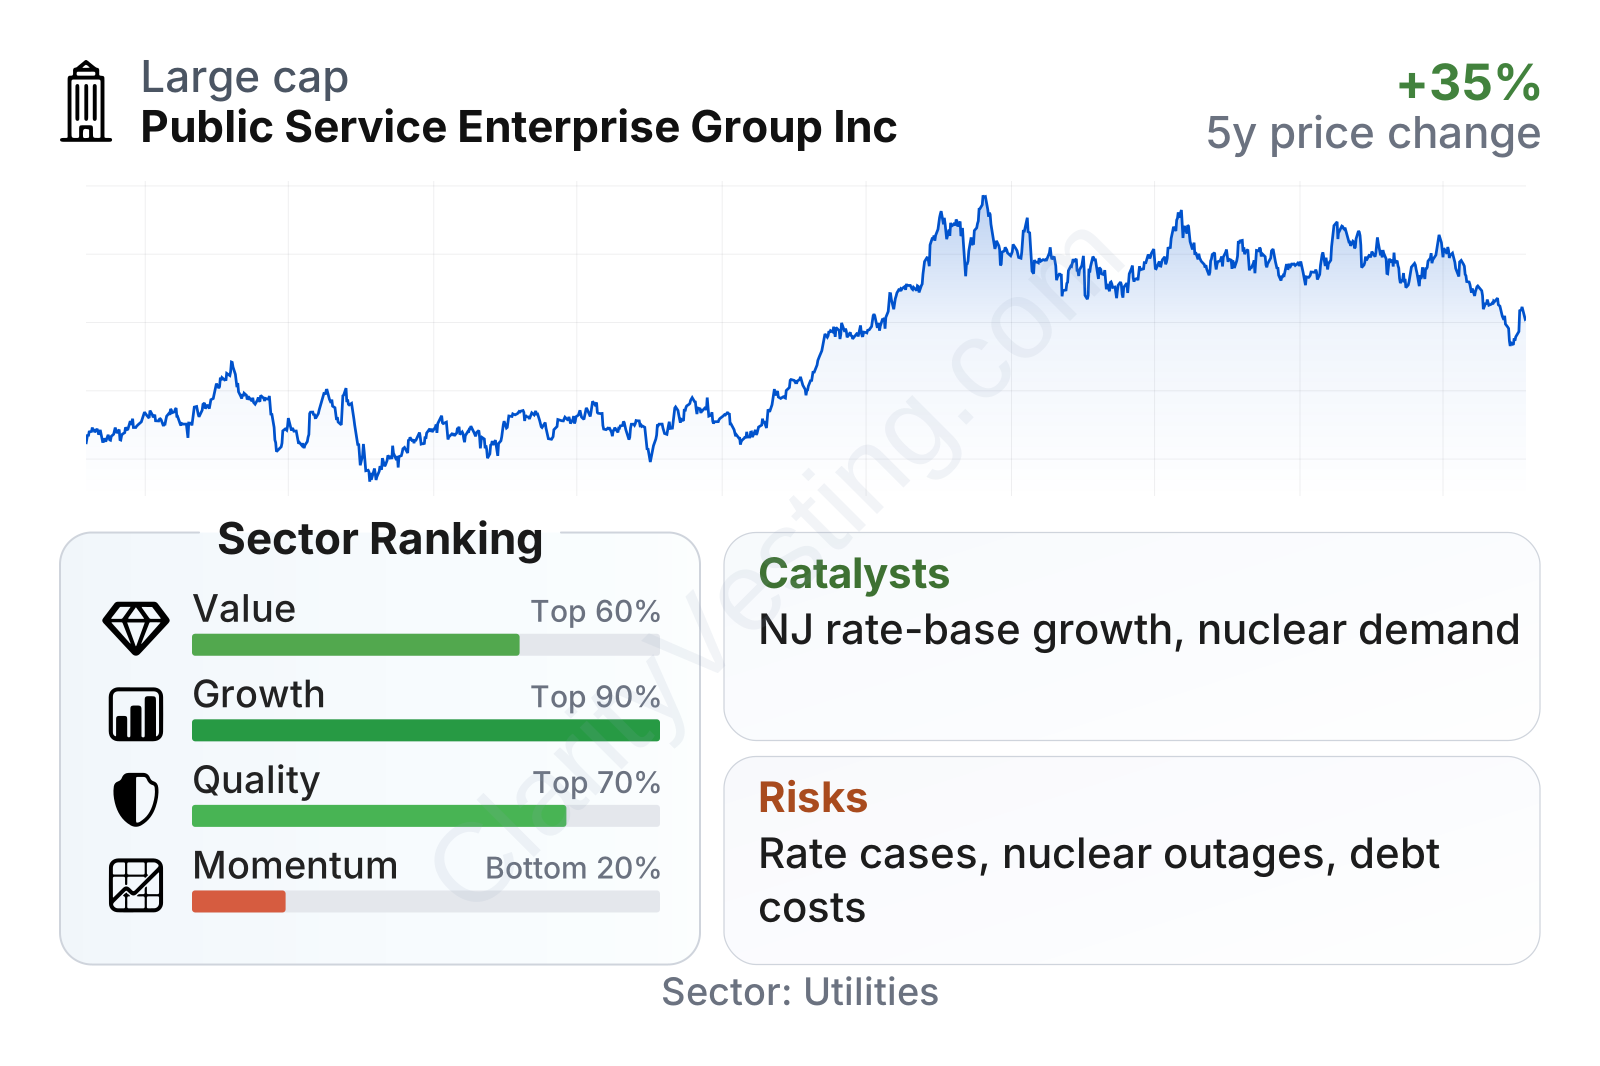
PEG is a large-cap utility with relatively low share-price volatility, as reflected by a beta well below 1. On valuation, its earnings multiple is close to the sector median, while its price-to-book ratio is somewhat higher, suggesting the market places some premium on the quality of its assets and earnings profile. The company’s free cash flow yield stands out as stronger than the sector median, and its dividend yield is roughly in line with the utility sector. Growth and quality indicators are generally solid relative to peers, but recent market momentum has been weak, meaning the stock has lagged much of the sector over the last several months.
Growth
PEG operates in a sector that is not usually associated with rapid expansion, but it is positioned in parts of the utility market that are seeing meaningful investment needs. Electric grid modernization, resilience spending, higher power demand from data centers and electrification, and the need for reliable carbon-free generation all support long-term capital deployment. In other words, this is a steady-growth utility rather than a high-growth company, but the industry backdrop is constructive.
The company’s strategy makes sense in that context. Its regulated utility can grow earnings by investing in transmission, distribution, and gas infrastructure and then earning an authorized return on that larger asset base. That tends to create visible, repeatable growth when regulators remain supportive. At the same time, PEG’s ownership of nuclear generation gives it exposure to a part of the U.S. power system that has become more valuable as grid operators seek reliable, emissions-free electricity around the clock.
Revenue per share has trended upward over the past five years despite some year-to-year swings. That is consistent with a business that is gradually expanding through infrastructure investment and favorable utility rate-base growth rather than through sudden jumps in demand.
A notable positive point is cash generation. Free cash flow had been under pressure for a prolonged period, which is common for utilities during heavy investment cycles, but the latest trailing figure has turned clearly positive. That does not remove the capital intensity of the business, yet it does suggest improved financial flexibility compared with the earlier negative readings.
The strongest catalysts are tied to rate-base expansion at the regulated utility, continuing demand for dependable electricity, and the strategic importance of nuclear generation in a decarbonizing grid. Recent company communications have also emphasized multi-year capital investment plans and continued utility infrastructure spending, which are important because they support future earnings visibility more than short-term commodity moves do. If electricity demand in the Northeast strengthens further, especially from large commercial loads, PEG could be in a favorable position because it already operates in a dense, economically important service territory.
Risks
This article is for informational purposes only and does not constitute financial advice. Some content is AI-generated. See Disclaimer


