Stock Analysis · PG&E Corp (PCG)
Overview
PG&E Corporation is the parent company of Pacific Gas and Electric Company, one of the largest regulated electric and natural gas utilities in the United States. Its service territory covers a very large part of Northern and Central California, where it delivers electricity and natural gas to millions of homes, businesses, and public-sector customers. In simple terms, PG&E runs essential infrastructure: power lines, substations, gas pipelines, and related grid assets.
The business is mainly regulated, which means customer rates and much of the company’s earnings profile are shaped by decisions from California regulators rather than by open-market pricing. That makes the company less cyclical than many industrial or technology businesses, but it also means growth depends heavily on approved investments, operating execution, and public policy.
Based on company reporting, revenue is primarily generated from utility operations and can be understood in this order:
- Electric utility operations: approximately 80% to 85% of revenue. This includes transmission and distribution service, generation-related activities, and customer electricity delivery across PG&E’s regulated territory.
- Natural gas utility operations: approximately 15% to 20% of revenue. This includes gas transportation, distribution, and related regulated services for residential, commercial, and industrial users.
- Other activities: limited. The corporate parent has only a small amount of activity outside the regulated utility business.
What stands out most is that PG&E is not a diversified conglomerate. It is essentially a California utility with very large scale, high capital needs, and a business model tied to grid reliability, wildfire mitigation, and long-term infrastructure spending.
The broader financial flow shows a business that has lifted revenue and operating income over the past several years, but it also carries a heavy interest burden. That combination is important for long-term analysis: the core utility is producing meaningful operating earnings, yet a large part of that operating strength is offset by financing costs.
Key Figures
| Metric | Value | Sector ⓘ |
|---|---|---|
| Date | Oct 17, 2026 | |
| Context | ||
| Sector | Utilities | |
| Industry | Utilities - Regulated Electric | |
| Market Cap ⓘ | $40.02B | |
| Beta ⓘ | 0.28 | |
Value (Cheapness) | ||
| P/E Ratio ⓘ | 9.66 | 17.28 |
| P/B Ratio ⓘ | 0.89 | 1.51 |
| FCF Yield ⓘ | -10.65% | 0.65% |
| Dividend Yield ⓘ | 1.33% | 3.77% |
| EBIT / EV ⓘ | 5.88% | 5.01% |
| PEG ⓘ | 0.52 | |
Growth (Business expansion) | ||
| Revenue Growth ⓘ | 0.10% | 6.10% |
| RPS Growth (5Y CAGR) ⓘ | 2.15% | 3.87% |
| EPS Growth (5Y CAGR) ⓘ | -7.24% | -11.30% |
| BVPS Growth (5Y CAGR) ⓘ | 3.51% | 4.23% |
| Margin Growth (5Y Trend) ⓘ | 10.48% | 3.57% |
| FCF Growth (5Y CAGR) ⓘ | -13.27% | -8.84% |
| DPS Growth (5Y CAGR) ⓘ | N/A | 4.84% |
Quality (Business durability) | ||
| ROIC (Latest) ⓘ | 7.50% | 6.53% |
| ROA (Latest) ⓘ | 2.23% | 3.20% |
| ROIC (5Y Median) ⓘ | 6.97% | 5.95% |
| ROA (5Y Median) ⓘ | 1.85% | 2.75% |
| Net Debt / EBIT (Latest) ⓘ | 10.57 | 7.13 |
| Net Debt / EBIT (5Y Median) ⓘ | 16.09 | 7.23 |
| Net Debt / EBITDA (Latest) ⓘ | 5.83 | 4.31 |
| Net Debt / Assets ⓘ | 43.93% | 38.42% |
| EBITDA / Interest ⓘ | 3.52 | 4.58 |
| Operating Margin (Latest) ⓘ | 23.33% | 20.83% |
| Operating Margin (5Y Median) ⓘ | 14.53% | 20.08% |
| Debt to Equity (Latest) ⓘ | 190.86% | 137.69% |
| Profit Margin (Latest) ⓘ | 11.83% | 11.37% |
| Free Cash Flow (Latest) ⓘ | -$4.26B | |
Momentum (Price trend) | ||
| 3Y Return ⓘ | -17.48% | +52.37% |
| 12M Return (excl. last month) ⓘ | -11.04% | +8.84% |
| 6M Return ⓘ | -24.59% | -3.95% |
| Price vs. 200-Day MA ⓘ | -19.35% | -0.79% |
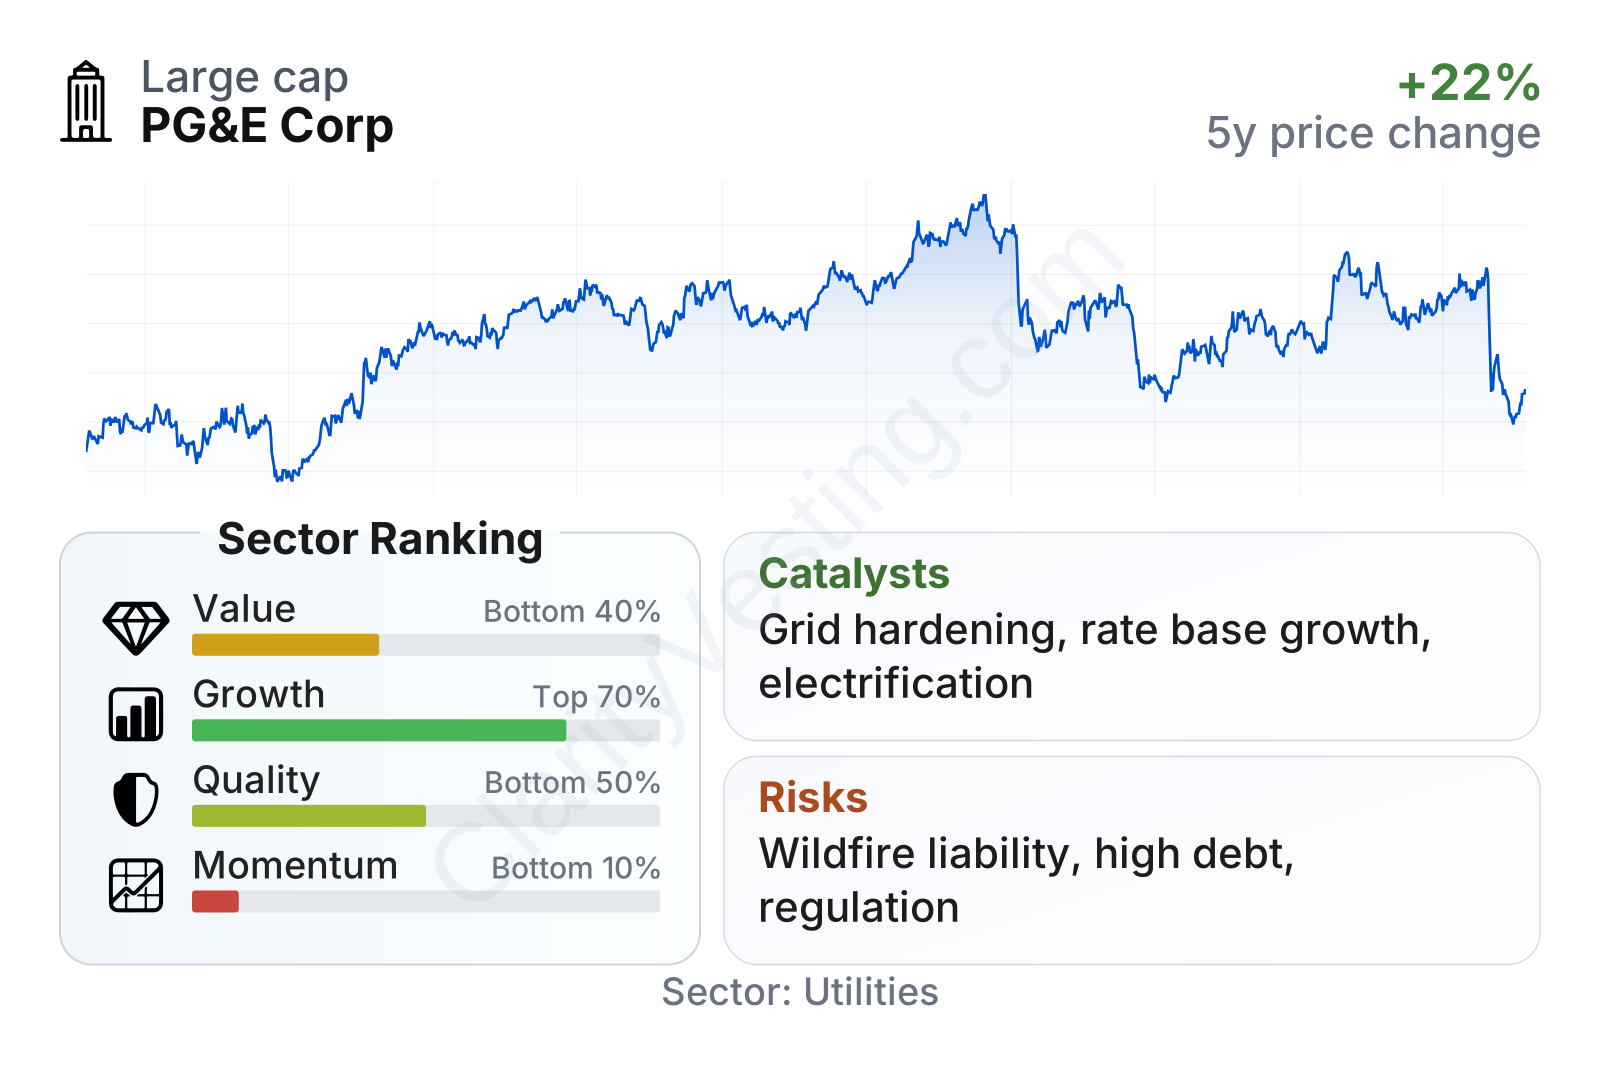
PG&E looks mixed on headline metrics. Valuation ratios such as earnings and book value sit below typical sector levels, which makes the shares look inexpensive on the surface. At the same time, quality indicators are held back by elevated leverage and negative free cash flow, while momentum remains weak after a sizable pullback from recent highs. Growth is neither exceptional nor absent: sales expansion has been modest, but operating margin improvement has been notable.
The stock history also helps frame expectations. Over the last several years, PG&E has been volatile rather than steadily compounding, with periods of recovery followed by sharp retrenchment. That pattern reflects how strongly the market reacts to wildfire concerns, financing needs, regulatory developments, and California policy risk.
Growth
PG&E operates in a sector that is structurally important and likely to remain so for decades. Electricity demand is supported by long-term themes such as electrification, grid hardening, transportation electrification, data infrastructure growth, and the need to connect more renewable power. For utilities, growth usually does not come from rapid volume expansion. Instead, it comes from investing in assets that regulators allow the company to earn a return on.
That framework matters a lot for PG&E. Its strategy is centered on rebuilding and modernizing the grid, undergrounding power lines in high-risk areas, improving vegetation management, strengthening transmission capacity, and making the system more resilient to extreme weather. If these projects are approved and executed well, they can expand the regulated asset base over time and support earnings growth.
A major catalyst is California’s need for a safer and more resilient power network. PG&E has repeatedly highlighted wildfire risk reduction, grid hardening, and infrastructure replacement as core priorities. Those are not optional upgrades. They are becoming central to operating a utility in California, which gives PG&E a large pipeline of necessary capital work.
Another opportunity comes from electricity demand over time. New homes, electric vehicles, building electrification, and larger power needs from commercial users can all support additional investment requirements. For a regulated utility, rising demand does not automatically produce explosive revenue growth, but it can reinforce the case for more transmission and distribution spending.
Revenue per share has been relatively stable with a modest upward trend over the last five years. That is consistent with a utility that is growing, but not in a high-speed way. The more encouraging point is that the business has largely held onto a higher revenue base rather than giving back earlier gains.
Free cash flow is the biggest growth-related complication. PG&E’s recent profile remains deeply negative because the company is spending heavily on infrastructure and system improvements. In a utility, negative free cash flow is not automatically a warning sign if the spending is productive and recoverable through future rates. Still, it means growth depends on access to debt and equity financing, and that makes execution and regulation especially important.
Recent company updates have continued to emphasize capital investment, safety work, and operational resilience. In practice, the long-term opportunity is clear: California needs major utility investment, and PG&E already owns a massive service network in that market. The main question is not whether the work is needed, but whether the company can complete it efficiently enough to translate that need into durable shareholder value.
Risks
This article is for informational purposes only and does not constitute financial advice. Some content is AI-generated. See Disclaimer


