Stock Analysis · Permian Basin Royalty Trust (PBT)
Overview
Permian Basin Royalty Trust is not a traditional operating oil and gas company. It is a royalty trust that owns interests in oil and natural gas properties in the Permian Basin of Texas, one of the best-known producing regions in the United States. The trust does not drill wells itself, run large field operations, or build infrastructure. Instead, it receives royalty income from production on underlying properties and passes most of that cash through to unitholders after expenses.
That business model makes the trust relatively simple to understand: revenue depends mainly on how much oil and gas is produced from the properties and the prices received for those volumes. Costs at the trust level are usually low because the operating work is handled by third parties, not by the trust itself.
The main economic sources are concentrated in commodity production rather than diversified business lines.
- Oil production royalties: likely the largest source of value and cash flow, because crude oil typically carries higher pricing per unit than natural gas and has historically been the main driver of Permian economics.
- Natural gas royalties: an important secondary source tied to gas volumes produced from the underlying properties.
- Natural gas liquids royalties: a smaller but still relevant contributor where production streams include liquids separated from natural gas.
- Other income and adjustments: minor items such as timing differences, reserve adjustments, and administrative effects may influence reported distributable income, but these are usually much smaller than commodity-linked royalties.
Because the trust structure is narrow, the key question for long-term analysis is not product diversification, but whether the underlying properties can keep producing economically for years while commodity prices remain supportive.
The earnings profile has historically been extremely lean, with only modest administrative costs relative to revenue. That helps explain why reported margins are unusually high versus most energy companies. At the same time, revenue has moved sharply up and down from year to year, which is typical for a royalty vehicle exposed to oil and gas cycles.
Key Figures
| Metric | Value | Sector ⓘ |
|---|---|---|
| Date | Oct 24, 2026 | |
| Context | ||
| Sector | Energy | |
| Industry | Oil & Gas Midstream | |
| Market Cap ⓘ | $1.58B | |
| Beta ⓘ | 0.56 | |
Value (Cheapness) | ||
| P/E Ratio ⓘ | 96.91 | 15.40 |
| P/B Ratio ⓘ | 9,689.45 | 1.71 |
| FCF Yield ⓘ | N/A | 8.24% |
| Dividend Yield ⓘ | 0.81% | 3.52% |
| EBIT / EV ⓘ | 1.05% | 7.45% |
| PEG ⓘ | 1.12 | |
Growth (Business expansion) | ||
| Revenue Growth ⓘ | 34.40% | 26.85% |
| RPS Growth (5Y CAGR) ⓘ | 8.10% | 6.78% |
| EPS Growth (5Y CAGR) ⓘ | -42.42% | -14.41% |
| BVPS Growth (5Y CAGR) ⓘ | -17.60% | 6.08% |
| Margin Growth (5Y Trend) ⓘ | -2.11% | 0.55% |
| FCF Growth (5Y CAGR) ⓘ | N/A | 2.75% |
| DPS Growth (5Y CAGR) ⓘ | 7.47% | 16.79% |
Quality (Business durability) | ||
| ROIC (Latest) ⓘ | N/A | 11.30% |
| ROA (Latest) ⓘ | 357.42% | 6.00% |
| ROIC (5Y Median) ⓘ | N/A | 10.35% |
| ROA (5Y Median) ⓘ | N/A | 5.46% |
| Net Debt / EBIT (Latest) ⓘ | -0.14 | 1.64 |
| Net Debt / EBIT (5Y Median) ⓘ | -0.11 | 1.82 |
| Net Debt / EBITDA (Latest) ⓘ | -0.14 | 1.08 |
| Net Debt / Assets ⓘ | -93.29% | 17.29% |
| EBITDA / Interest ⓘ | N/A | 9.53 |
| Operating Margin (Latest) ⓘ | 91.58% | 16.21% |
| Operating Margin (5Y Median) ⓘ | 93.73% | 20.55% |
| Debt to Equity (Latest) ⓘ | N/A | 52.27% |
| Profit Margin (Latest) ⓘ | 91.58% | 8.79% |
| Free Cash Flow (Latest) ⓘ | N/A | |
Momentum (Price trend) | ||
| 3Y Return ⓘ | +80.19% | +68.93% |
| 12M Return (excl. last month) ⓘ | +90.59% | +42.90% |
| 6M Return ⓘ | +54.66% | +9.18% |
| Price vs. 200-Day MA ⓘ | +28.45% | +9.87% |
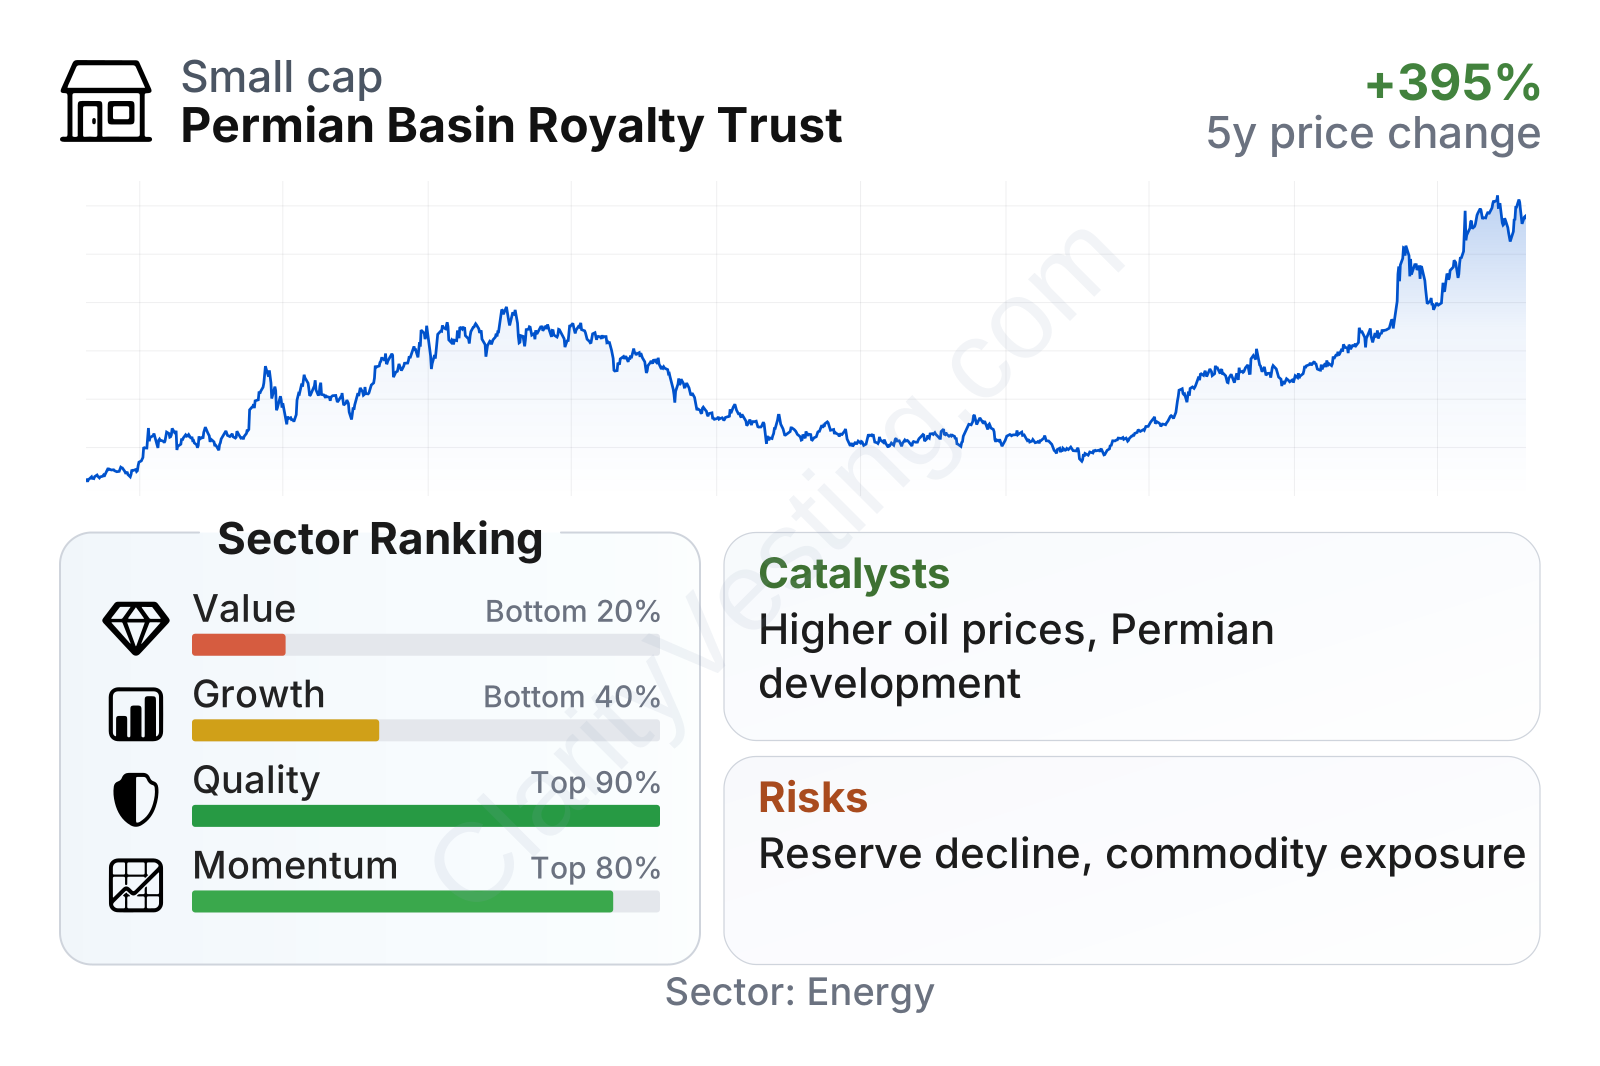
Permian Basin Royalty Trust is a relatively small public energy vehicle with a market value around the lower end of listed U.S. energy names. The share price has been highly cyclical over the past several years, with a steep run-up after the 2021 period, a large pullback, and then another strong rebound into 2026.
The table points to a mixed profile. On one hand, quality metrics look unusually strong: margins are very high, leverage appears limited on a net basis, and the trust structure keeps overhead light. On the other hand, value metrics screen poorly. The earnings multiple is far above the sector median, the cash flow yield is weak, and the trailing dividend yield is below the sector median despite the trust’s income-oriented reputation.
Growth indicators also require nuance. Recent year-over-year revenue growth has improved again, and the longer-term revenue-per-share trend has been positive, but earnings per share and book value trends over five years have been weak. Momentum has clearly improved, with recent price performance running ahead of many energy peers.
Growth
The trust operates in a sector that remains strategically important. The Permian Basin is one of the most productive oil regions in North America, with established infrastructure, deep operator expertise, and a large inventory of hydrocarbon resources. That gives royalty interests in the basin a structural advantage over less competitive producing regions.
Still, this is not a growth company in the usual sense. Permian Basin Royalty Trust does not reinvest aggressively, acquire new platforms regularly, or build new operating capacity. Future expansion depends mostly on operator activity on the underlying properties, production performance, and commodity prices. In other words, growth can happen, but it is largely external rather than driven by an internal corporate strategy.
Revenue growth has been volatile. There were periods of extraordinary increases during the energy upcycle, followed by steep declines as pricing and production conditions changed. More recently, growth turned positive again, with the latest year-over-year reading above the sector median. That improvement matters, but the longer pattern still shows a business that can swing widely from one year to the next.
Free cash flow history is harder to use here than for an ordinary corporation. Royalty trusts often distribute cash rather than retain it for reinvestment, so traditional free cash flow analysis can be less informative. Even so, the recent picture does not show a durable upward cash-compounding pattern, which limits the case for viewing the trust as a long-duration growth vehicle.
The most important catalyst is simple: stronger oil prices combined with stable or improving production from the underlying assets. If operators continue developing the trust’s acreage efficiently, distributable income can respond quickly because the trust itself has little operating cost burden. A second support factor is the location of the properties. The Permian remains one of the most attractive U.S. basins for capital allocation, so assets there are more likely to receive continued development attention than marginal fields elsewhere.
Recent market action also suggests renewed optimism around the trust’s near-term earnings power. That does not change the structure of the business, but it indicates that the market is reacting to improved commodity-linked expectations.
Risks
This article is for informational purposes only and does not constitute financial advice. Some content is AI-generated. See Disclaimer


