Stock Analysis · Petroleo Brasileiro Petrobras SA (PBR)
Overview
Petróleo Brasileiro S.A. - Petrobras is Brazil’s state-controlled energy company and one of the world’s largest integrated oil and gas groups. It explores for oil and natural gas, produces those hydrocarbons, refines crude into fuels, and sells petroleum products in Brazil and abroad. The company is especially important in Brazil’s offshore “pre-salt” fields, deepwater reservoirs that have become the core of its production base and one of the main reasons Petrobras remains a major global producer.
Its business is still centered on oil and gas rather than renewable energy. Petrobras does have activities in natural gas, power, biofuels, and low-carbon initiatives, but these remain much smaller than its upstream oil operations. For a long-term view, the essential point is simple: Petrobras is primarily a very large offshore oil producer with downstream refining and fuel distribution exposure tied closely to the Brazilian market.
The main revenue sources are dominated by refined products and crude oil sales. Based on the company’s recent annual reporting structure, the mix can be summarized approximately as follows:
- Diesel, gasoline, and other oil products: about 55% to 65% of revenue. This includes fuels and other refined products sold mainly in Brazil.
- Crude oil exports and domestic crude sales: about 25% to 35% of revenue. This is heavily influenced by international oil prices and export volumes.
- Natural gas and related products: about 5% to 10% of revenue. This includes gas sales and some related infrastructure or processing activity.
- Other businesses: generally less than 5% of revenue. This includes electricity, fertilizers, and smaller operating lines.
This structure matters because it shows Petrobras is exposed to two major drivers at the same time: global commodity prices and Brazilian fuel market conditions. It also means strong upstream profitability can sometimes offset weaker refining conditions, while domestic policy decisions can still shape realized prices and margins.
Over the last several years, revenue and profit have moved sharply with oil-price cycles, but the business has remained highly cash generative. The broad pattern has been a jump in results during the 2022 commodity boom, a normalization afterward, and then a recovery in profitability rather than a straight-line expansion.
The flow of revenue to profit shows a cyclical business with large swings in earnings, but also one that has repeatedly converted a meaningful share of sales into operating income and net profit. Even after a weak 2024, profitability improved again in 2025, which supports the view that Petrobras remains structurally capable of producing substantial cash despite volatility.
Key Figures
| Metric | Value | Sector ⓘ |
|---|---|---|
| Date | Oct 31, 2026 | |
| Context | ||
| Sector | Energy | |
| Industry | Oil & Gas Integrated | |
| Market Cap ⓘ | $141.97B | |
| Beta ⓘ | -0.23 | |
Value (Cheapness) | ||
| P/E Ratio ⓘ | 5.56 | 15.08 |
| P/B Ratio ⓘ | 1.53 | 1.73 |
| FCF Yield ⓘ | 13.16% | 8.21% |
| Dividend Yield ⓘ | 16.44% | 3.46% |
| EBIT / EV ⓘ | 17.92% | 7.46% |
| PEG ⓘ | 6.01 | |
Growth (Business expansion) | ||
| Revenue Growth ⓘ | 42.30% | 26.85% |
| RPS Growth (5Y CAGR) ⓘ | 1.51% | 6.98% |
| EPS Growth (5Y CAGR) ⓘ | -15.73% | -13.45% |
| BVPS Growth (5Y CAGR) ⓘ | 2.30% | 6.27% |
| Margin Growth (5Y Trend) ⓘ | -4.62% | 0.61% |
| FCF Growth (5Y CAGR) ⓘ | -14.62% | 3.35% |
| DPS Growth (5Y CAGR) ⓘ | -10.61% | 16.79% |
Quality (Business durability) | ||
| ROIC (Latest) ⓘ | 11.04% | 11.53% |
| ROA (Latest) ⓘ | 10.96% | 6.01% |
| ROIC (5Y Median) ⓘ | 21.54% | 10.35% |
| ROA (5Y Median) ⓘ | 10.91% | 5.46% |
| Net Debt / EBIT (Latest) ⓘ | 1.83 | 1.61 |
| Net Debt / EBIT (5Y Median) ⓘ | 1.45 | 1.82 |
| Net Debt / EBITDA (Latest) ⓘ | 1.33 | 1.03 |
| Net Debt / Assets ⓘ | 26.03% | 16.57% |
| EBITDA / Interest ⓘ | 10.94 | 9.67 |
| Operating Margin (Latest) ⓘ | 33.18% | 15.60% |
| Operating Margin (5Y Median) ⓘ | 39.54% | 20.44% |
| Debt to Equity (Latest) ⓘ | 76.21% | 51.18% |
| Profit Margin (Latest) ⓘ | 24.32% | 8.82% |
| Free Cash Flow (Latest) ⓘ | $18.68B | |
Momentum (Price trend) | ||
| 3Y Return ⓘ | +108.66% | +73.65% |
| 12M Return (excl. last month) ⓘ | +69.81% | +36.08% |
| 6M Return ⓘ | +7.63% | +6.58% |
| Price vs. 200-Day MA ⓘ | +18.79% | +11.74% |
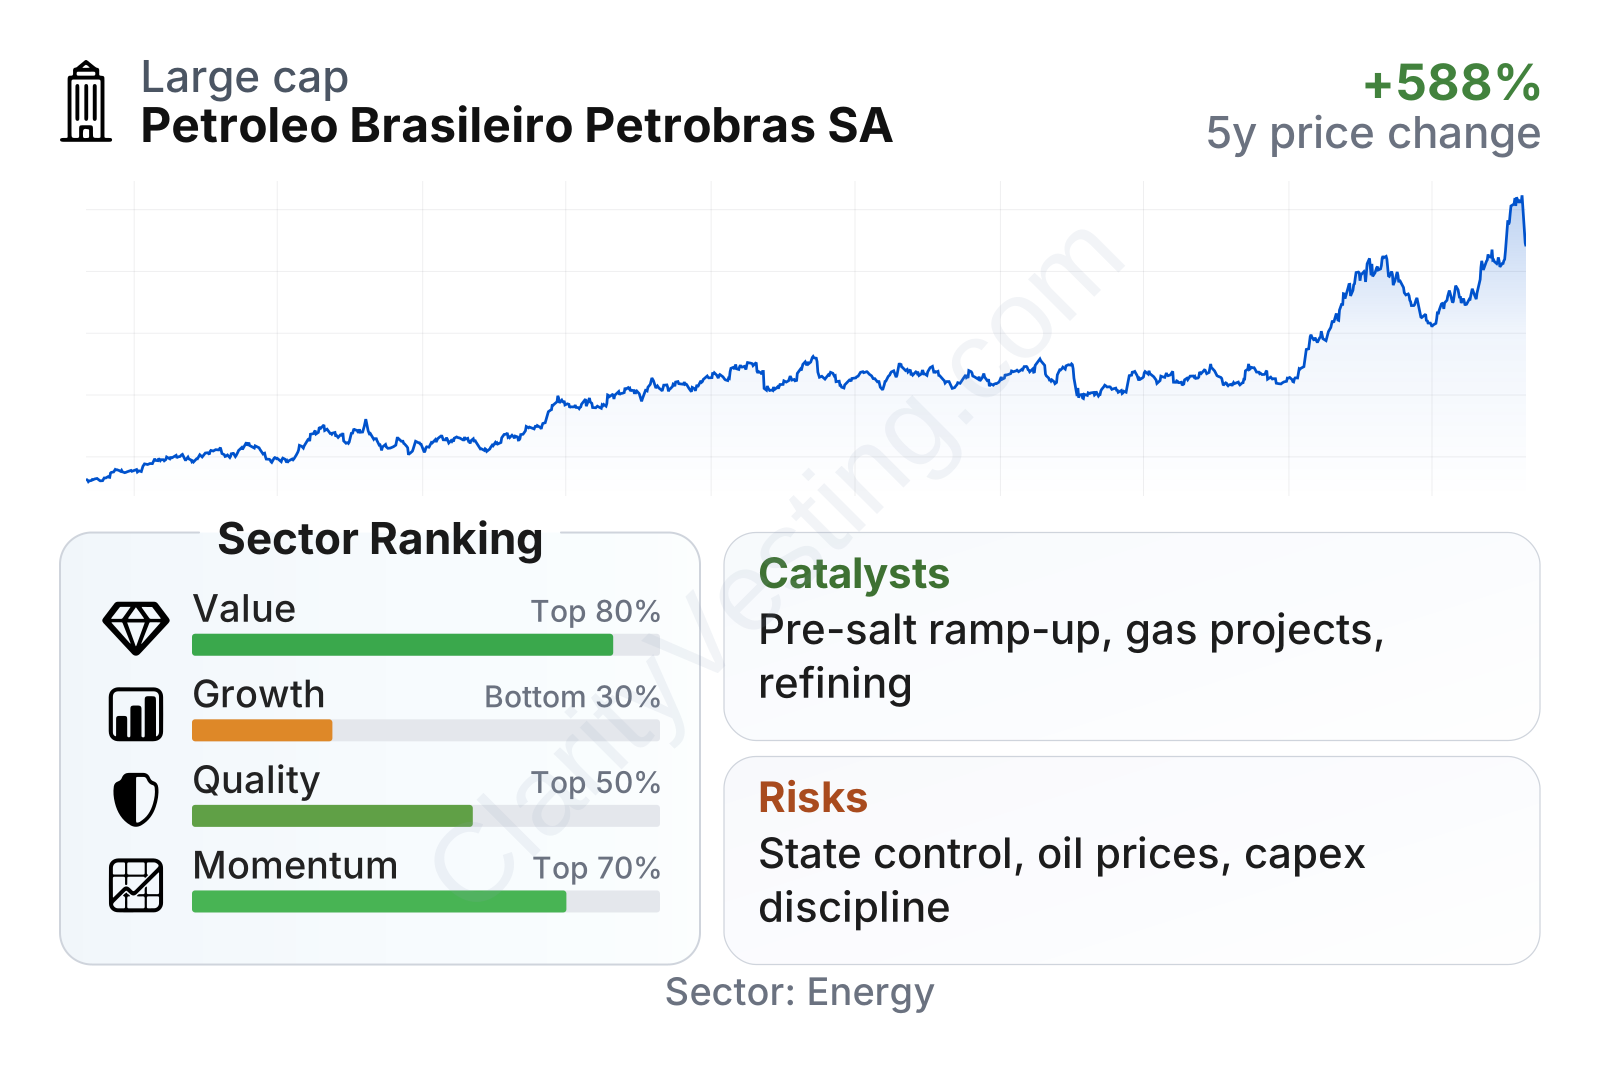
Petrobras combines a very large market presence with unusually low headline valuation multiples for a company of its size. The value profile stands well above most energy peers, helped by a low earnings multiple, a modest price-to-book ratio, a free-cash-flow yield above the sector median, and an exceptionally high trailing dividend yield. Quality is also stronger than many integrated peers, especially on operating margin and long-term returns on capital, although leverage remains somewhat higher than the sector median. The weakest area is growth: recent year-over-year revenue has rebounded, but the longer five-year trends in revenue per share, earnings, and free cash flow are less favorable.
The stock-price history reflects that mixed picture. Over the past few years, the shares have moved up substantially, but not in a smooth way. The pattern fits a company whose market value is shaped by oil prices, distributions, Brazilian politics, and changing views on capital allocation.
Growth
Petrobras operates in a sector that is mature rather than structurally fast growing. Global oil demand is still significant and remains critical for transportation, petrochemicals, shipping, and aviation, but over very long periods the industry faces pressure from energy transition policies, efficiency gains, and electrification. That means Petrobras is not a classic growth company. Its long-term appeal depends more on the quality and cost of its resource base than on broad industry expansion.
That resource base is the key growth argument. Petrobras has some of the world’s most productive offshore assets in Brazil’s pre-salt region. These fields are known for high output per well and comparatively attractive lifting costs, which can support returns even when oil prices are not at peak levels. The company’s strategy in recent years has continued to prioritize upstream investment, reserve replacement, and production from large offshore projects while keeping refining and gas infrastructure relevant to the domestic market.
Revenue growth has been uneven, which is normal for a commodity producer. There were strong surges during high-price periods, then contractions as prices and operating conditions normalized, followed by a renewed rebound in the latest periods. That pattern suggests Petrobras’ growth is driven less by steady demand expansion and more by a combination of project ramp-ups, export volumes, and oil-price movements.
Free cash flow has come down from the extraordinary highs seen earlier in the cycle, but it remains substantial in absolute terms. For a long-term view, this is important: Petrobras does not need rapid top-line growth to remain relevant if its assets keep producing strong cash generation. The central question is whether that cash is directed into productive investment, debt discipline, and consistent shareholder distributions rather than being diluted by weaker capital allocation.
One important catalyst is continued growth from major offshore production systems entering or approaching full output. Another is Petrobras’ push to expand natural gas infrastructure and capture more value from associated gas. In addition, refining upgrades can improve product yields and reduce import dependency in Brazil. Recent company updates have also highlighted new discoveries, project start-ups, and progress on the 2025-2029 investment plan, all of which reinforce the idea that Petrobras still has visible operating momentum even in a mature sector.
Risks
This article is for informational purposes only and does not constitute financial advice. Some content is AI-generated. See Disclaimer


