Stock Analysis · Patria Investments Ltd (PAX)
Overview
Patria Investments Ltd is an alternative asset manager focused mainly on Latin America. In simple terms, it raises money from institutional and wealthy clients, invests that money across private markets, and earns fees for managing those funds. Its platform covers private equity, infrastructure, credit, real estate, public equities, and solutions for institutional clients. The company has built its business around long-duration assets and strategies that often benefit from economic development, energy transition, transport, digital infrastructure, and the growing need for private capital in the region.
Its revenue comes mostly from recurring management fees, with additional income from performance-linked fees and investment income. Based on company reporting structure and recent annual disclosures, the main sources of revenue are approximately:
- Management fees: about 70% to 80% — recurring fees charged on assets under management across private markets, infrastructure, credit, real estate, and related strategies.
- Performance-related revenues: about 10% to 20% — carried interest and incentive fees earned when investment returns exceed certain hurdles or assets are realized successfully.
- Advisory, placement, and other fee revenues: about 5% to 10% — services tied to fund structuring, capital formation, and specialized mandates.
- Investment income and principal investment activities: usually a smaller and more variable share — returns from Patria’s own balance-sheet investments and co-investments.
That mix matters for long-term analysis. A business led by management fees tends to be more stable than one relying mostly on gains from buying and selling assets. Patria’s model therefore combines a recurring revenue base with upside from performance fees, which can make results stronger in good periods but less predictable from one year to the next.
Over the last five years, total revenue has trended upward from roughly $236 million to about $384 million, while gross profit also increased materially. At the same time, net income has been more uneven, showing that growth in the platform has not always translated into smooth bottom-line expansion.
The broad picture is one of a scalable asset-management franchise: revenue has expanded meaningfully, and the cost structure still leaves room for solid operating profitability, but earnings can swing when expenses, financing costs, taxes, or performance-related items move against the company.
Key Figures
| Metric | Value | Sector ⓘ |
|---|---|---|
| Date | Oct 17, 2026 | |
| Context | ||
| Sector | Financial Services | |
| Industry | Asset Management | |
| Market Cap ⓘ | $1.89B | |
| Beta ⓘ | 0.78 | |
Value (Cheapness) | ||
| P/E Ratio ⓘ | 26.74 | 12.26 |
| P/B Ratio ⓘ | 3.35 | 1.23 |
| FCF Yield ⓘ | 6.51% | 10.40% |
| Dividend Yield ⓘ | 5.29% | 3.02% |
| EBIT / EV ⓘ | 7.38% | 8.14% |
| PEG ⓘ | N/A | |
Growth (Business expansion) | ||
| Revenue Growth ⓘ | 34.90% | 9.35% |
| RPS Growth (5Y CAGR) ⓘ | 8.83% | 12.19% |
| EPS Growth (5Y CAGR) ⓘ | -8.99% | -9.53% |
| BVPS Growth (5Y CAGR) ⓘ | -2.59% | 4.99% |
| Margin Growth (5Y Trend) ⓘ | -17.84% | -3.86% |
| FCF Growth (5Y CAGR) ⓘ | 25.03% | 4.81% |
| DPS Growth (5Y CAGR) ⓘ | -9.07% | 8.79% |
Quality (Business durability) | ||
| ROIC (Latest) ⓘ | N/A | 9.49% |
| ROE (Latest) ⓘ | 10.00% | 13.90% |
| ROA (Latest) ⓘ | 3.51% | 1.55% |
| ROIC (5Y Median) ⓘ | 17.23% | 7.86% |
| ROE (5Y Median) ⓘ | 16.13% | 12.17% |
| ROA (5Y Median) ⓘ | 10.70% | 1.30% |
| Net Debt / EBIT (Latest) ⓘ | 2.32 | 0.96 |
| Net Debt / EBIT (5Y Median) ⓘ | -0.00 | 0.73 |
| Net Debt / EBITDA (Latest) ⓘ | 2.05 | 0.92 |
| Operating Margin (Latest) ⓘ | 29.56% | 22.30% |
| Operating Margin (5Y Median) ⓘ | 36.40% | 24.63% |
| Debt to Equity (Latest) ⓘ | 66.53% | 58.56% |
| Profit Margin (Latest) ⓘ | 16.35% | 26.57% |
| Free Cash Flow (Latest) ⓘ | $122.76M | |
Momentum (Price trend) | ||
| 3Y Return ⓘ | +0.96% | +88.33% |
| 12M Return (excl. last month) ⓘ | -27.44% | +19.38% |
| 6M Return ⓘ | -5.79% | +4.75% |
| Price vs. 200-Day MA ⓘ | -1.74% | +3.50% |
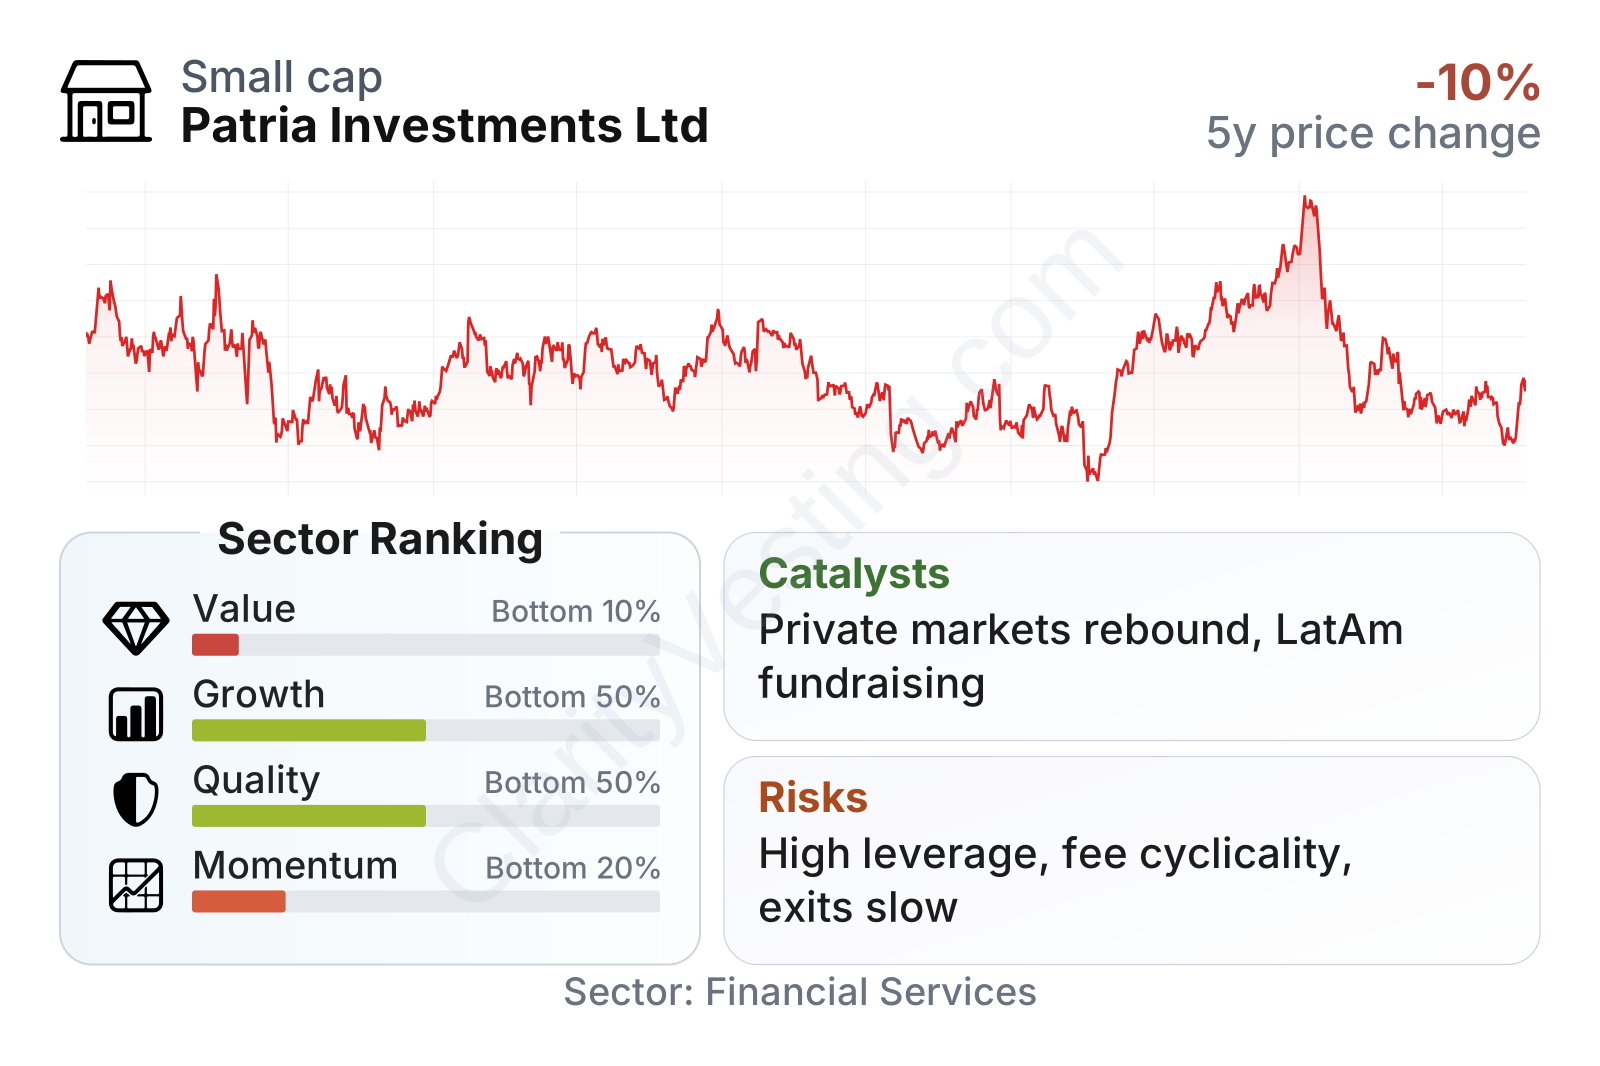
Patria is a mid-sized listed asset manager with a market value around $1.6 billion and a below-market beta, which suggests the stock has historically moved less violently than the broader market. Even so, the share price record has been volatile, with a strong rally into early 2026 followed by a sharp pullback.
The factor profile is mixed. On valuation, the stock screens more expensive than the sector on both earnings and book value multiples, which places it in the weaker end of the sector for pure cheapness. On quality, however, the business remains above average, supported by strong operating margins and returns on assets that are notably higher than many peers. Growth signals are uneven: recent revenue growth is strong, but five-year trends for earnings, book value per share, and margins are less favorable. Momentum is clearly weak, with the stock trailing the sector over multiple periods.
A notable feature is the income component. The trailing dividend yield is around 6%, well above the sector median, although the payout history has not been consistently rising. Free cash flow generation remains meaningful, which helps support the business despite uneven accounting earnings.
Growth
Patria operates in a part of finance that still has room to expand. Alternative asset management has grown globally as pension funds, insurers, sovereign investors, and wealthy clients look for returns and diversification beyond traditional stocks and bonds. In Latin America, that trend is paired with a structural financing gap: infrastructure, energy, logistics, agribusiness, and middle-market companies often need capital that public markets and banks do not fully provide. That creates a reasonable long-term backdrop for managers with local scale and relationships.
Patria’s strategy also makes sense in that context. The firm is not trying to dominate one narrow niche; instead, it has built a multi-product platform across private equity, infrastructure, credit, real estate, and public strategies. That can deepen client relationships and reduce reliance on a single fund cycle. The company has also used acquisitions and partnerships to broaden distribution and product breadth, which is a common way for alternative managers to increase fee-earning assets faster than organic fundraising alone.
Recent business momentum looks better in revenue than in per-share value creation. Year-over-year revenue growth is running near 35%, well above the sector median. Free cash flow over a five-year period has also grown strongly. But longer-term per-share measures tell a more cautious story: revenue per share growth has been positive but not exceptional, while book value per share has declined over five years and operating margin has compressed from earlier highs.
Earnings per share recovered after 2022 and improved through 2025, which suggests the platform has retained earnings power despite a difficult market backdrop for exits and fundraising. That said, the progression has not been smooth enough to describe as a steady compounding pattern.
The decline in book value per share over several years is worth watching because it can indicate dilution, capital allocation pressure, or the effect of acquisitions and distributions outweighing retained value creation. The partial rebound more recently is helpful, but the longer trend is still not especially strong.
One important catalyst is the normalization of private markets activity. If transaction volumes, fundraising, and asset realizations improve, Patria could benefit from higher performance revenues and new management fees. Another is continued institutional interest in Latin American infrastructure and energy transition projects, where local expertise can matter a lot. Company communications in 2026 have also highlighted platform expansion and continued product development, which supports the idea that fee-earning assets can keep growing if capital raising remains healthy.
Risks
This article is for informational purposes only and does not constitute financial advice. Some content is AI-generated. See Disclaimer


