Stock Analysis · Occidental Petroleum Corporation (OXY)
Overview
Occidental Petroleum is a large U.S. energy company active across oil and gas production, chemicals, and a growing carbon management business. Its core activity is exploring for and producing crude oil, natural gas liquids, and natural gas, with major operations in the Permian Basin in Texas and New Mexico, the Rocky Mountains, the Gulf of Mexico, and the Middle East and North Africa. The company also owns OxyChem, a chemicals business that makes products such as chlorine, caustic soda, and vinyl materials used in construction, water treatment, and manufacturing.
In simple terms, Occidental earns most of its money by producing hydrocarbons and selling them into global energy markets. It also has a more stable industrial business through chemicals, and it has been investing in lower-carbon activities through its subsidiary 1PointFive, which focuses on carbon capture, sequestration, and direct air capture.
Based on recent annual reporting, Occidental’s revenue mix is still dominated by upstream energy operations, while chemicals and midstream/marketing make up much smaller portions. Approximate revenue sources are:
- Oil and gas sales: roughly 75% to 85% of total revenue. This includes crude oil, natural gas liquids, and natural gas production from the U.S. and international assets.
- Chemical sales: roughly 10% to 20% of total revenue. This mainly comes from basic chemicals and vinyls produced by OxyChem.
- Midstream, marketing, and other: generally a small single-digit to low-teens percentage depending on commodity prices and trading activity. This includes gathering, processing, transportation, power, and marketing-related activities.
This structure matters for long-term analysis because Occidental is not a pure oil price bet. It is still highly tied to oil and gas prices, but OxyChem and the carbon management platform can soften part of the cyclicality and create additional strategic options over time.
The business has become leaner since the 2022 earnings peak. Revenue and profit have come down from that unusually strong period, but the cost base has also moved lower, and interest expense is well below 2021 levels. That points to a company that used the cash windfall from high commodity prices to strengthen its financial footing rather than simply expand spending.
Key Figures
| Metric | Value | Sector ⓘ |
|---|---|---|
| Date | Oct 03, 2026 | |
| Context | ||
| Sector | Energy | |
| Industry | Oil & Gas E&P | |
| Market Cap ⓘ | $54.92B | |
| Beta ⓘ | 0.16 | |
Value (Cheapness) | ||
| P/E Ratio ⓘ | 16.55 | 14.47 |
| P/B Ratio ⓘ | 1.36 | 1.70 |
| FCF Yield ⓘ | 9.67% | 8.66% |
| Dividend Yield ⓘ | 1.78% | 3.77% |
| EBIT / EV ⓘ | 8.42% | 7.46% |
| PEG ⓘ | 1.13 | |
Growth (Business expansion) | ||
| Revenue Growth ⓘ | 53.40% | 27.35% |
| RPS Growth (5Y CAGR) ⓘ | -5.50% | 6.75% |
| EPS Growth (5Y CAGR) ⓘ | -23.25% | -15.45% |
| BVPS Growth (5Y CAGR) ⓘ | 33.94% | 5.85% |
| Margin Growth (5Y Trend) ⓘ | -1.83% | 0.75% |
| FCF Growth (5Y CAGR) ⓘ | -13.93% | 3.62% |
| DPS Growth (5Y CAGR) ⓘ | 16.17% | 16.85% |
Quality (Business durability) | ||
| ROIC (Latest) ⓘ | 9.59% | 11.33% |
| ROA (Latest) ⓘ | 8.86% | 6.03% |
| ROIC (5Y Median) ⓘ | 9.47% | 10.16% |
| ROA (5Y Median) ⓘ | 3.82% | 5.34% |
| Net Debt / EBIT (Latest) ⓘ | 1.66 | 1.62 |
| Net Debt / EBIT (5Y Median) ⓘ | 4.76 | 1.91 |
| Net Debt / EBITDA (Latest) ⓘ | 0.75 | 1.06 |
| Net Debt / Assets ⓘ | 13.04% | 17.29% |
| EBITDA / Interest ⓘ | 16.54 | 9.64 |
| Operating Margin (Latest) ⓘ | 25.09% | 16.32% |
| Operating Margin (5Y Median) ⓘ | 20.49% | 19.53% |
| Debt to Equity (Latest) ⓘ | 35.04% | 54.41% |
| Profit Margin (Latest) ⓘ | 30.32% | 8.79% |
| Free Cash Flow (Latest) ⓘ | $5.31B | |
Momentum (Price trend) | ||
| 3Y Return ⓘ | -9.92% | +62.93% |
| 12M Return (excl. last month) ⓘ | +29.02% | +44.83% |
| 6M Return ⓘ | -14.11% | -1.62% |
| Price vs. 200-Day MA ⓘ | +3.57% | +5.18% |
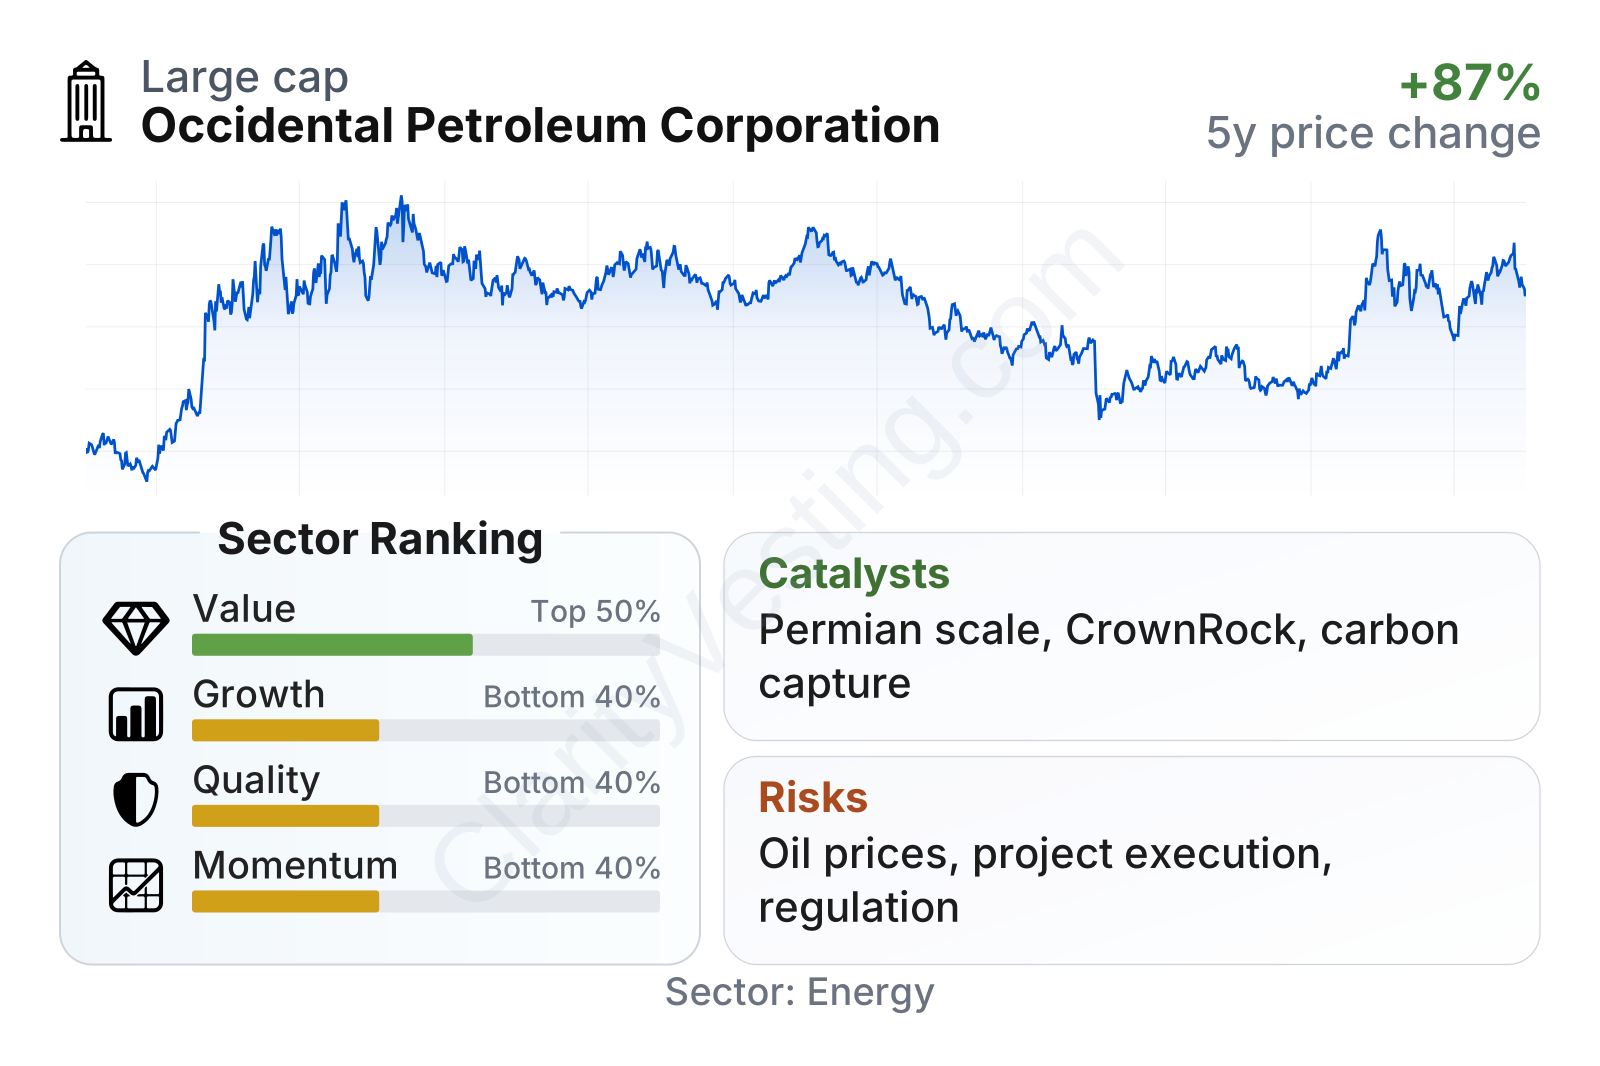
Occidental is a very large energy company, and its share price history shows how cyclical the sector remains: the stock surged with the 2022 oil rally, then gave back part of those gains as commodity prices normalized. In the latest factor snapshot, valuation looks mixed rather than stretched. Earnings multiples are a bit above the sector median, but price-to-book is lower and cash flow-based measures remain competitive. Free cash flow yield is slightly stronger than the sector median, while EBIT relative to enterprise value is also above median, suggesting the market is not assigning an extreme premium despite the company’s scale.
On quality, the picture is better than the overall factor ranking may suggest. Profitability is currently strong, with operating margin around the mid-20% range and profit margin far above the sector median. Balance sheet metrics have improved materially: debt-to-equity has fallen to roughly 35%, well below the sector median, and interest coverage is strong. The weaker area is growth over a multi-year period, where revenue per share, earnings, and free cash flow have been volatile and compare less favorably with the broader energy group.
Growth
Occidental operates in a sector that is mature, cyclical, and unlikely to deliver steady demand growth in the same way as software or semiconductors. However, long-term energy demand remains large, and low-cost oil and gas assets can still create substantial value if they are managed with discipline. In that context, Occidental’s growth case is less about rapid expansion and more about extracting more value from advantaged assets, extending inventory life, improving recovery rates, and adding new earnings streams in chemicals and carbon management.
The center of that strategy is the Permian Basin, where Occidental has a large acreage position and extensive operating experience. Scale in the Permian matters because it can lower development costs, improve infrastructure efficiency, and give the company flexibility to shift drilling toward the most profitable wells. The CrownRock acquisition reinforced that position by adding more high-quality Permian inventory, which can support production and cash generation for years if integration goes well.
Short-term growth has been uneven. Recent year-over-year revenue changes show the typical pattern for a commodity producer: strong rebounds when prices and volumes improve, followed by contractions when market conditions weaken. That means reported growth should not be read the same way as growth in a subscription or consumer platform business. What matters more is whether Occidental can keep production economics attractive through the cycle and translate that into durable cash generation.
Free cash flow has clearly cooled from the exceptional levels reached after the 2022 commodity spike, but it remains meaningful in absolute terms. Even after that normalization, Occidental is still producing billions of dollars in trailing free cash flow. That leaves room for debt reduction, dividends, buybacks, and investment in newer businesses without depending entirely on external financing.
A notable longer-term catalyst is carbon capture. Through 1PointFive, Occidental has positioned itself as one of the more visible traditional energy companies in direct air capture and CO2 infrastructure. This is still early-stage and not yet a profit engine on the scale of oil production, but it could become strategically important if carbon markets, tax incentives, and industrial decarbonization spending continue to develop. The company’s existing experience with CO2 handling and enhanced oil recovery gives it a practical advantage that many peers do not have to the same extent.
Another supportive element is chemicals. OxyChem gives Occidental exposure to industrial demand rather than only energy prices. That business is not immune to cycles, but it can provide a different earnings pattern and helps diversify the company’s cash sources.
Risks
This article is for informational purposes only and does not constitute financial advice. Some content is AI-generated. See Disclaimer


