Stock Analysis · Ovintiv Inc (OVV)
Overview
Ovintiv Inc is a North American oil and natural gas producer. It explores for hydrocarbons, drills wells, develops acreage, and sells crude oil, condensate, natural gas liquids, and natural gas. The company focuses on a smaller number of large resource plays rather than spreading activity across many regions. Its core operations are in the United States and Canada, with major positions in the Permian Basin, Montney, and Anadarko Basin.
In simple terms, Ovintiv makes money by producing energy from underground reserves and selling those volumes into commodity markets. That means results depend on two big variables: how much it produces and the prices it receives for oil, gas, and related liquids. Compared with more diversified energy groups, Ovintiv is mainly an upstream company, so it does not have large refining or marketing operations to soften swings in commodity prices.
Based on recent company reporting, revenue is primarily generated from commodity sales, with oil and condensate now carrying the largest weight. A practical breakdown is:
- Oil and condensate: approximately 50% to 60% of total revenue. This includes crude oil and light hydrocarbons sold mainly from U.S. shale assets.
- Natural gas liquids: approximately 15% to 25%. This includes products such as propane, butane, and other liquids separated from gas production.
- Natural gas: approximately 20% to 30%. This comes from dry gas and liquids-rich gas production, especially from Montney and Anadarko.
The business mix matters because liquids generally earn higher margins than dry natural gas. Ovintiv has spent several years shifting toward higher-value barrels, which helps explain why its portfolio is more oil-weighted than it used to be.
The broader financial path over the last few years shows a classic commodity cycle: revenue and profits surged in the strong 2022 market, then moderated as prices normalized. Even so, the company has remained cash generative and has used that cash to support shareholder returns and improve its balance sheet.
That visual highlights a sharp earnings peak in 2022 followed by lower but still meaningful profitability afterward. It also shows that Ovintiv kept overhead relatively contained while commodity prices, production mix, and operating costs drove most of the swings in net income.
Key Figures
| Metric | Value | Sector ⓘ |
|---|---|---|
| Date | Oct 17, 2026 | |
| Context | ||
| Sector | Energy | |
| Industry | Oil & Gas E&P | |
| Market Cap ⓘ | $18.44B | |
| Beta ⓘ | 0.66 | |
Value (Cheapness) | ||
| P/E Ratio ⓘ | 18.57 | 15.44 |
| P/B Ratio ⓘ | 1.64 | 1.73 |
| FCF Yield ⓘ | 23.76% | 8.20% |
| Dividend Yield ⓘ | 1.84% | 3.59% |
| EBIT / EV ⓘ | 3.18% | 7.46% |
| PEG ⓘ | 3.94 | |
Growth (Business expansion) | ||
| Revenue Growth ⓘ | 29.70% | 26.90% |
| RPS Growth (5Y CAGR) ⓘ | 0.86% | 6.90% |
| EPS Growth (5Y CAGR) ⓘ | -15.11% | -15.73% |
| BVPS Growth (5Y CAGR) ⓘ | 22.65% | 6.07% |
| Margin Growth (5Y Trend) ⓘ | -5.12% | 0.58% |
| FCF Growth (5Y CAGR) ⓘ | -1.67% | 1.86% |
| DPS Growth (5Y CAGR) ⓘ | 26.86% | 16.79% |
Quality (Business durability) | ||
| ROIC (Latest) ⓘ | 8.47% | 11.40% |
| ROA (Latest) ⓘ | 4.76% | 6.06% |
| ROIC (5Y Median) ⓘ | 17.54% | 10.30% |
| ROA (5Y Median) ⓘ | 9.93% | 5.42% |
| Net Debt / EBIT (Latest) ⓘ | 6.37 | 1.64 |
| Net Debt / EBIT (5Y Median) ⓘ | 3.53 | 1.83 |
| Net Debt / EBITDA (Latest) ⓘ | 1.50 | 1.08 |
| Net Debt / Assets ⓘ | 21.88% | 17.29% |
| EBITDA / Interest ⓘ | 7.31 | 9.64 |
| Operating Margin (Latest) ⓘ | 6.87% | 16.27% |
| Operating Margin (5Y Median) ⓘ | 19.26% | 20.39% |
| Debt to Equity (Latest) ⓘ | 42.77% | 54.76% |
| Profit Margin (Latest) ⓘ | 9.66% | 8.82% |
| Free Cash Flow (Latest) ⓘ | $4.38B | |
Momentum (Price trend) | ||
| 3Y Return ⓘ | +45.04% | +67.38% |
| 12M Return (excl. last month) ⓘ | +60.15% | +49.19% |
| 6M Return ⓘ | +23.01% | +7.07% |
| Price vs. 200-Day MA ⓘ | +20.68% | +9.56% |
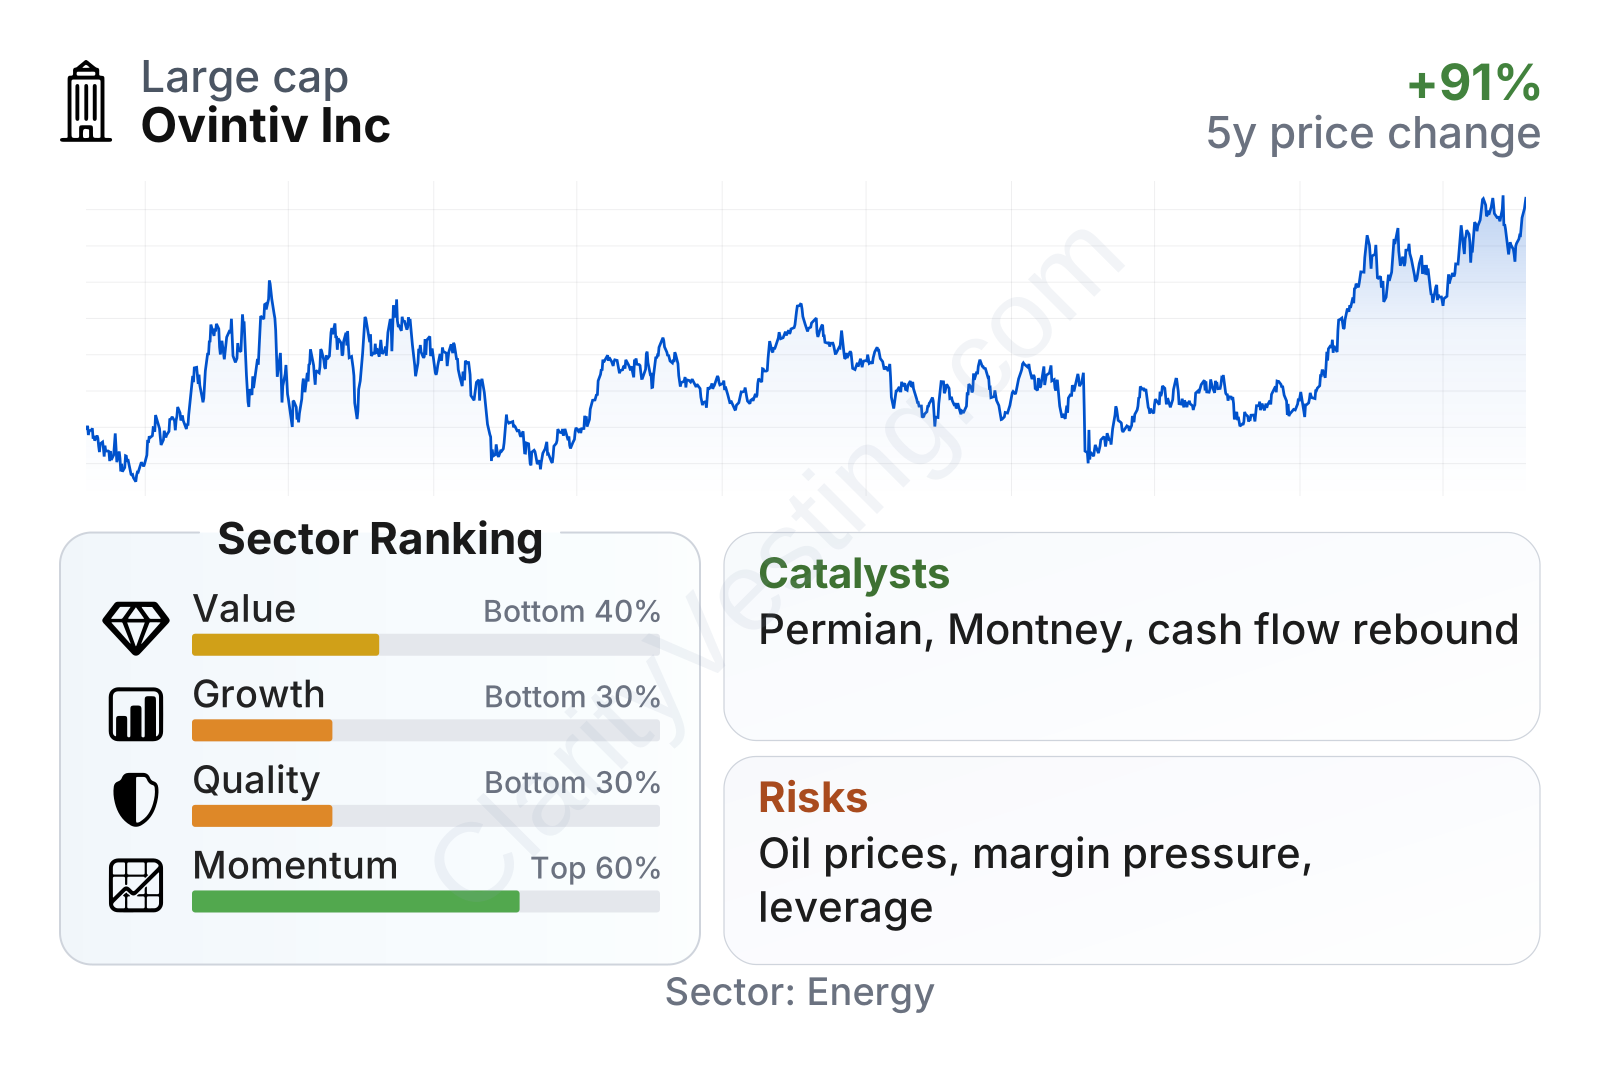
Ovintiv sits in the large independent producer category, with a stock that has been volatile over time but less so than many energy names, as suggested by a beta well below 1. On valuation, the picture is mixed: free cash flow yield is very strong versus the sector, but earnings-based and enterprise-value-based measures are not especially cheap relative to peers. Growth and quality rankings are weaker, reflecting uneven multi-year operating trends, while momentum has improved more recently.
The share price history also shows how sensitive market sentiment is to oil and gas conditions. After large moves during the 2022 commodity spike and a softer 2025 period, the stock rebounded strongly into 2026, suggesting the market is again recognizing the company’s cash generation and operating leverage.
Growth
Ovintiv operates in a sector that is mature rather than structurally high growth. Global oil and gas demand is still substantial, but long-term expansion is usually driven more by supply discipline, productivity gains, and commodity prices than by rapid end-market growth. For that reason, the main question is less about whether energy demand explodes and more about whether Ovintiv can keep producing profitable barrels at low cost while allocating capital carefully.
Its strategy is coherent for that environment. Management has concentrated the portfolio around high-return basins, emphasized capital efficiency, and targeted a mix tilted toward oil and premium liquids. That approach can create value even without major production growth, because stronger well productivity and a better product mix can lift cash flow per share. The company has also leaned on disciplined capital returns rather than chasing volume for its own sake, which is often a sensible model in upstream energy.
Recent revenue growth has turned positive again after a weak stretch in 2024 and parts of 2025. That rebound matters, but it should still be read as cyclical rather than purely structural. In this industry, year-over-year revenue can swing sharply with commodity prices, so a recovery does not automatically mean a smooth multi-year growth runway.
Free cash flow is one of the most encouraging parts of the current profile. After dipping earlier in the cycle, trailing free cash flow has climbed back to a very strong level, now in the multi-billion-dollar range. That gives Ovintiv room to reduce debt, repurchase shares, and sustain dividends without depending on external financing. In an upstream producer, that flexibility is often one of the clearest indicators of operational health.
A notable catalyst is the company’s continued focus on premium drilling inventory in the Permian and Montney. Those basins are among the most attractive unconventional resource areas in North America, with established infrastructure and repeatable drilling results. If Ovintiv keeps improving well performance or benefits from stronger oil and gas pricing, cash generation can move materially because the business has high operating leverage.
Another positive recent development is that market performance has improved over the last year, which usually reflects stronger confidence in the near-term earnings and cash flow setup. That does not remove cyclicality, but it suggests the operating outlook has become more favorable than it was during the softer part of 2025.
Risks
This article is for informational purposes only and does not constitute financial advice. Some content is AI-generated. See Disclaimer


