Stock Analysis · Outfront Media Inc (OUT)
Overview
Outfront Media Inc is a real estate investment trust focused on advertising space rather than traditional property leasing. It owns or operates billboard displays, transit advertising assets, and a growing digital display network across the United States. In simple terms, the company rents visibility: brands pay Outfront to place ads on roadside signs, in transit systems, and on digital screens in high-traffic locations.
The business is built around long-lived physical assets in attractive urban and commuter corridors. That gives the company recurring exposure to local advertisers, national brands, and public agencies. Digital conversion is especially important because one screen can host multiple advertisers, rotate campaigns quickly, and generally produce better revenue per location than a static display.
Based on the company’s reporting structure, the main revenue sources are approximately:
- Billboard advertising: about 75% to 80% of revenue. This includes traditional roadside billboards and digital billboards, sold to local and national advertisers.
- Transit advertising: about 20% to 25% of revenue. This covers ads on buses, trains, stations, street furniture, and transit-related locations, often under contracts with municipalities and transportation authorities.
- Other revenue: a small residual share, mainly from production, installation, and related services tied to advertising campaigns.
Over the last several years, revenue has recovered from the pandemic shock and has stabilized around the low-$1.8 billion range annually. Profitability has been uneven because this is a capital-intensive business with meaningful depreciation, lease costs, and interest expense, but the company returned to solid positive earnings after a weak 2023. The broad pattern is a business with valuable assets and improving execution, but still one that depends heavily on advertising demand and balance sheet discipline.
The long-term picture shows revenue rebuilding after 2021, a major earnings disruption in 2023, and a clear recovery in 2024. One useful takeaway is that gross profit stayed substantial even when net income swung sharply, which suggests the biggest pressure points were below the gross profit line, especially operating charges and financing costs rather than a collapse in basic demand.
Key Figures
| Metric | Value | Sector ⓘ |
|---|---|---|
| Date | Oct 17, 2026 | |
| Context | ||
| Sector | Real Estate | |
| Industry | REIT - Specialty | |
| Market Cap ⓘ | $5.23B | |
| Beta ⓘ | 1.51 | |
Value (Cheapness) | ||
| P/E Ratio ⓘ | 21.35 | 17.38 |
| P/B Ratio ⓘ | 7.98 | 0.85 |
| FCF Yield ⓘ | 5.67% | 7.38% |
| Dividend Yield ⓘ | 3.97% | 4.85% |
| EBIT / EV ⓘ | 4.36% | 3.78% |
| PEG ⓘ | 0.99 | |
Growth (Business expansion) | ||
| Revenue Growth ⓘ | 13.50% | 5.30% |
| RPS Growth (5Y CAGR) ⓘ | 1.95% | 6.02% |
| EPS Growth (5Y CAGR) ⓘ | -2.24% | -11.37% |
| BVPS Growth (5Y CAGR) ⓘ | -18.80% | 0.45% |
| Margin Growth (5Y Trend) ⓘ | 5.06% | -0.22% |
| FCF Growth (5Y CAGR) ⓘ | 120.02% | 5.40% |
| DPS Growth (5Y CAGR) ⓘ | 33.31% | 5.02% |
Quality (Business durability) | ||
| ROIC (Latest) ⓘ | 12.13% | 5.69% |
| ROE (Latest) ⓘ | 36.89% | 7.56% |
| ROA (Latest) ⓘ | 4.67% | 2.85% |
| ROIC (5Y Median) ⓘ | 7.07% | 4.22% |
| ROE (5Y Median) ⓘ | 10.93% | 6.03% |
| ROA (5Y Median) ⓘ | 2.40% | 2.44% |
| Net Debt / EBIT (Latest) ⓘ | 10.36 | 7.59 |
| Net Debt / EBIT (5Y Median) ⓘ | 14.21 | 8.40 |
| Net Debt / EBITDA (Latest) ⓘ | 7.43 | 5.27 |
| Net Debt / Assets ⓘ | 77.82% | 37.76% |
| EBITDA / Interest ⓘ | 1.90 | 4.10 |
| Operating Margin (Latest) ⓘ | 20.48% | 35.29% |
| Operating Margin (5Y Median) ⓘ | 15.93% | 37.31% |
| Debt to Equity (Latest) ⓘ | 596.06% | 88.87% |
| Profit Margin (Latest) ⓘ | 12.66% | 19.61% |
| Free Cash Flow (Latest) ⓘ | $296.30M | |
Momentum (Price trend) | ||
| 3Y Return ⓘ | +295.24% | +30.75% |
| 12M Return (excl. last month) ⓘ | +54.06% | +4.36% |
| 6M Return ⓘ | +5.20% | -2.52% |
| Price vs. 200-Day MA ⓘ | +4.28% | -2.34% |
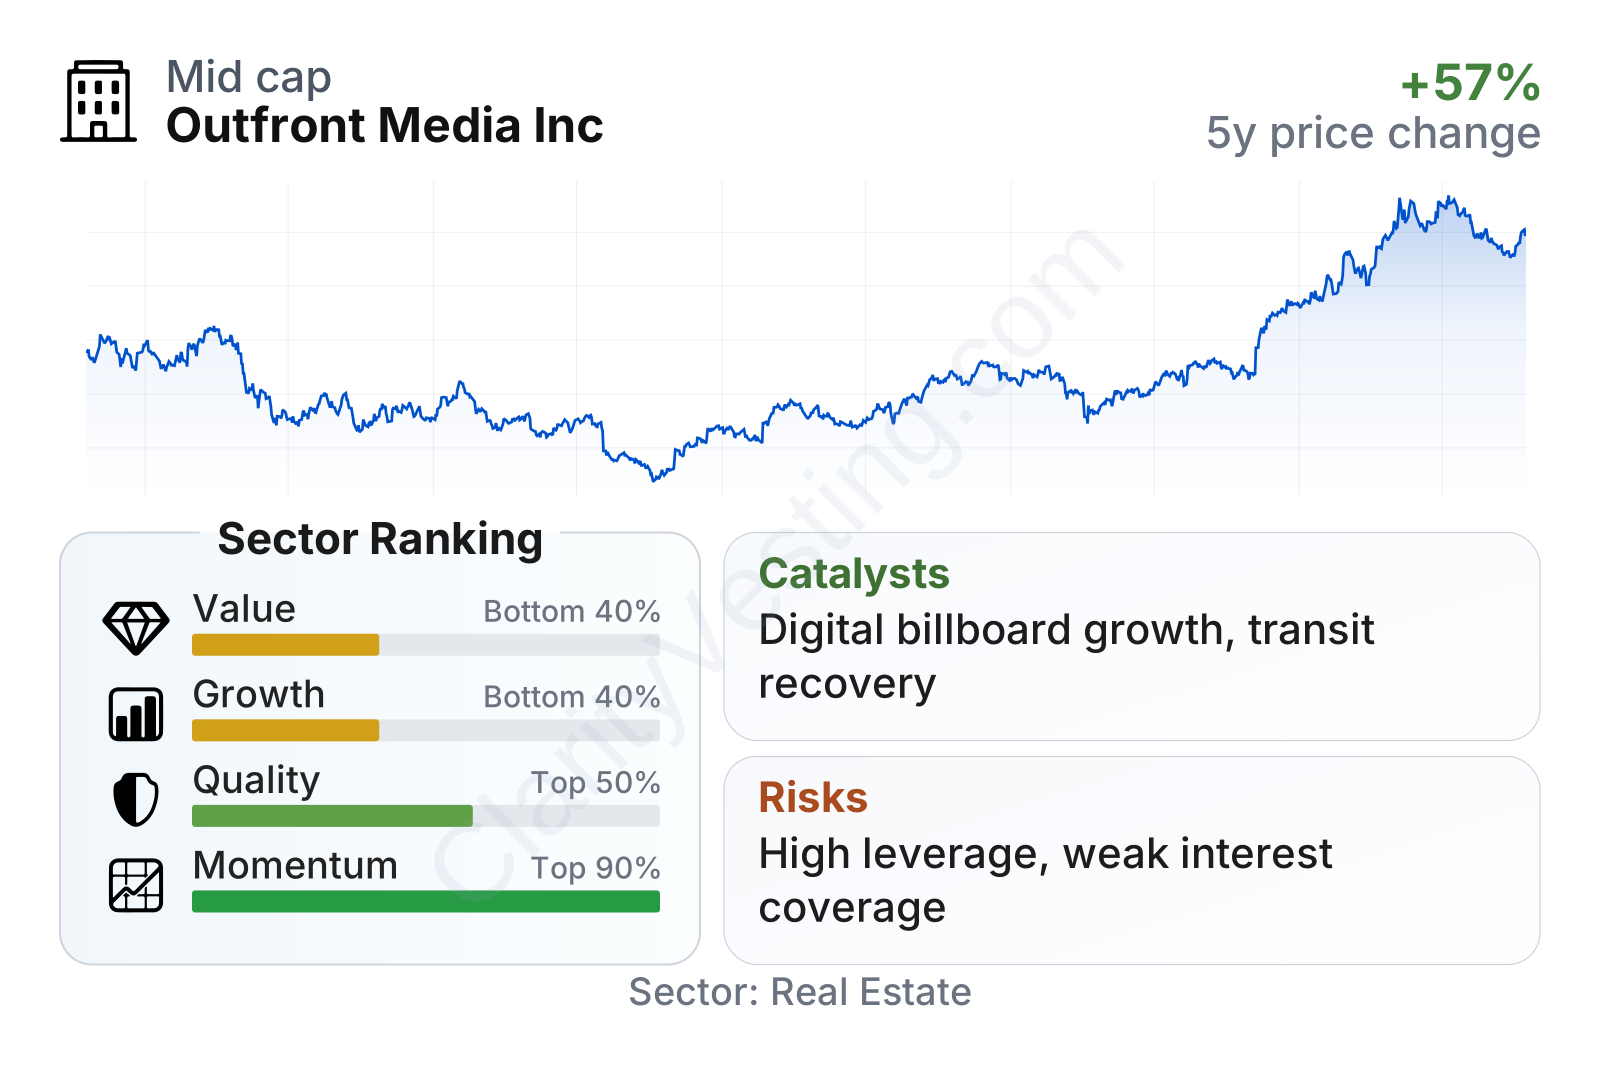
Outfront currently sits in a mixed position. Profitability and capital returns look stronger than much of its real estate peer group, and recent stock momentum has been exceptionally strong. But value and growth rankings are weaker because leverage remains elevated, book value has been under pressure over time, and the share price has moved up faster than several traditional valuation anchors. In short, the market is recognizing operational improvement, while the balance sheet still limits the quality of that improvement.
The stock’s move since late 2023 has been dramatic, climbing from distressed levels to much higher territory by mid-2026. That re-rating usually means the market believes cash flow durability and recovery prospects have improved materially. At the same time, a higher beta points to above-average share price swings, which fits a company tied to both economic activity and debt costs.
Growth
Outfront operates in the out-of-home advertising market, which is still a relevant part of the media mix even after years of digital disruption. The reason is simple: outdoor ads reach consumers in the physical world, especially in commuting corridors and dense urban areas where attention is difficult to capture elsewhere. That does not make the sector a rapid-growth industry, but it does give it staying power. The most attractive subsegment is digital out-of-home, where operators can improve utilization, change campaigns instantly, and serve more advertisers from a single location.
That is where Outfront’s strategy makes the most sense. The company has been investing in digital displays and using data-driven tools to help advertisers measure campaigns more effectively. This matters because advertisers increasingly want flexibility, audience targeting, and proof that spending is working. A larger digital footprint can lift revenue productivity without requiring the company to add entirely new locations at the same pace.
Revenue per share has been relatively steady over the last few years rather than explosive. That supports the view of Outfront as a mature infrastructure-like media platform: growth is more likely to come from pricing, digital conversion, and better occupancy than from a sudden surge in asset count. The recent year-over-year revenue growth rate looks strong, but the longer pattern is better described as recovery and optimization than sustained high growth.
The dividend per share rebounded sharply after the pandemic period and has since stayed fairly stable around a little above $1.20 annually. For a REIT, that stability is important because it signals that management has moved the payout onto a more normal footing. It also shows that cash generation has improved enough to support distributions while the company continues operating and investing in its display network.
A meaningful catalyst is the combination of digital expansion and transit normalization. As commuting patterns and urban activity continue to normalize, transit-related advertising has room to strengthen. Another useful tailwind is that outdoor advertising can benefit when marketers want broad local reach without depending entirely on online platforms. More recently, the company has also highlighted continued demand from national advertisers and progress in digital inventory monetization, both of which support the idea that Outfront’s best growth path is higher productivity from existing assets rather than aggressive expansion.
Risks
This article is for informational purposes only and does not constitute financial advice. Some content is AI-generated. See Disclaimer


