Stock Analysis · Blue Owl Technology Finance Corp (OTF)
Overview
Blue Owl Technology Finance Corp is a specialty finance company focused on lending to venture-backed and growth-stage technology and life sciences businesses. It operates as a business development company, or BDC, which means it raises capital from shareholders and lenders, then invests that capital mainly in private loans. In simple terms, it is not building software or selling products itself; it is financing companies that do.
The company’s strategy is centered on senior secured lending, with an emphasis on borrowers that often have support from well-known private equity or venture capital sponsors. This matters because senior secured loans usually sit higher in the repayment order if a borrower runs into trouble. Blue Owl Technology Finance also benefits from being part of the broader Blue Owl platform, which gives it access to sourcing relationships, underwriting resources, and a larger brand in private credit.
Its revenue is mainly generated from interest and related income on its investment portfolio. Based on its business model and public filings, the main sources of revenue are broadly the following:
- Interest income from debt investments: approximately 85% to 95% of total investment income in a typical period. This includes recurring interest collected on first-lien, second-lien, and other structured loans.
- Fee income: approximately 3% to 10%. This can include origination fees, prepayment fees, end-of-term fees, and other loan-related charges.
- Dividend income and other investment income: generally a small contributor, often below 5%. This may come from equity co-investments, warrants, or other portfolio-related gains.
- Net realized and unrealized gains: these can materially affect reported earnings in some periods, but they are less predictable and are not the core recurring source of cash income.
The business is therefore relatively straightforward: raise capital, lend at spreads that exceed funding costs, manage credit risk, and distribute a large share of earnings to maintain BDC status. The biggest drivers of results are portfolio size, loan yields, funding costs, credit quality, and the level of repayments and new originations.
The longer-term financial pattern has been uneven but improved sharply in 2025, with revenue and net income rebounding after a weak 2022. Operating expenses have remained fairly contained relative to total revenue, while interest expense has grown as the portfolio and borrowing base expanded. That makes loan performance and funding discipline especially important going forward.
Key Figures
| Metric | Value | Sector ⓘ |
|---|---|---|
| Date | Oct 03, 2026 | |
| Context | ||
| Sector | Financial Services | |
| Industry | Asset Management | |
| Market Cap ⓘ | $4.49B | |
| Beta ⓘ | N/A | |
Value (Cheapness) | ||
| P/E Ratio ⓘ | 11.96 | 12.60 |
| P/B Ratio ⓘ | 0.60 | 1.23 |
| FCF Yield ⓘ | -6.73% | 10.16% |
| Dividend Yield ⓘ | 14.11% | 2.96% |
| EBIT / EV ⓘ | N/A | 7.77% |
| PEG ⓘ | N/A | |
Growth (Business expansion) | ||
| Revenue Growth ⓘ | 5.80% | 9.50% |
| RPS Growth (5Y CAGR) ⓘ | -0.44% | 12.10% |
| EPS Growth (5Y CAGR) ⓘ | N/A | -9.45% |
| BVPS Growth (5Y CAGR) ⓘ | 2.87% | 5.01% |
| Margin Growth (5Y Trend) ⓘ | 8.88% | -4.07% |
| FCF Growth (5Y CAGR) ⓘ | N/A | 4.96% |
| DPS Growth (5Y CAGR) ⓘ | 23.49% | 8.79% |
Quality (Business durability) | ||
| ROIC (Latest) ⓘ | N/A | 9.60% |
| ROE (Latest) ⓘ | 4.81% | 13.84% |
| ROA (Latest) ⓘ | 2.64% | 1.53% |
| ROIC (5Y Median) ⓘ | N/A | 7.86% |
| ROE (5Y Median) ⓘ | 10.67% | 12.20% |
| ROA (5Y Median) ⓘ | 5.54% | 1.29% |
| Net Debt / EBIT (Latest) ⓘ | N/A | 0.91 |
| Net Debt / EBIT (5Y Median) ⓘ | 5.17 | 0.74 |
| Net Debt / EBITDA (Latest) ⓘ | 10.59 | 0.97 |
| Operating Margin (Latest) ⓘ | N/A | 22.12% |
| Operating Margin (5Y Median) ⓘ | 95.76% | 24.39% |
| Debt to Equity (Latest) ⓘ | 94.93% | 60.37% |
| Profit Margin (Latest) ⓘ | 28.70% | 26.62% |
| Free Cash Flow (Latest) ⓘ | -$302.58M | |
Momentum (Price trend) | ||
| 3Y Return ⓘ | N/A | +89.23% |
| 12M Return (excl. last month) ⓘ | -11.49% | +17.35% |
| 6M Return ⓘ | -9.50% | +10.00% |
| Price vs. 200-Day MA ⓘ | -9.39% | +3.73% |
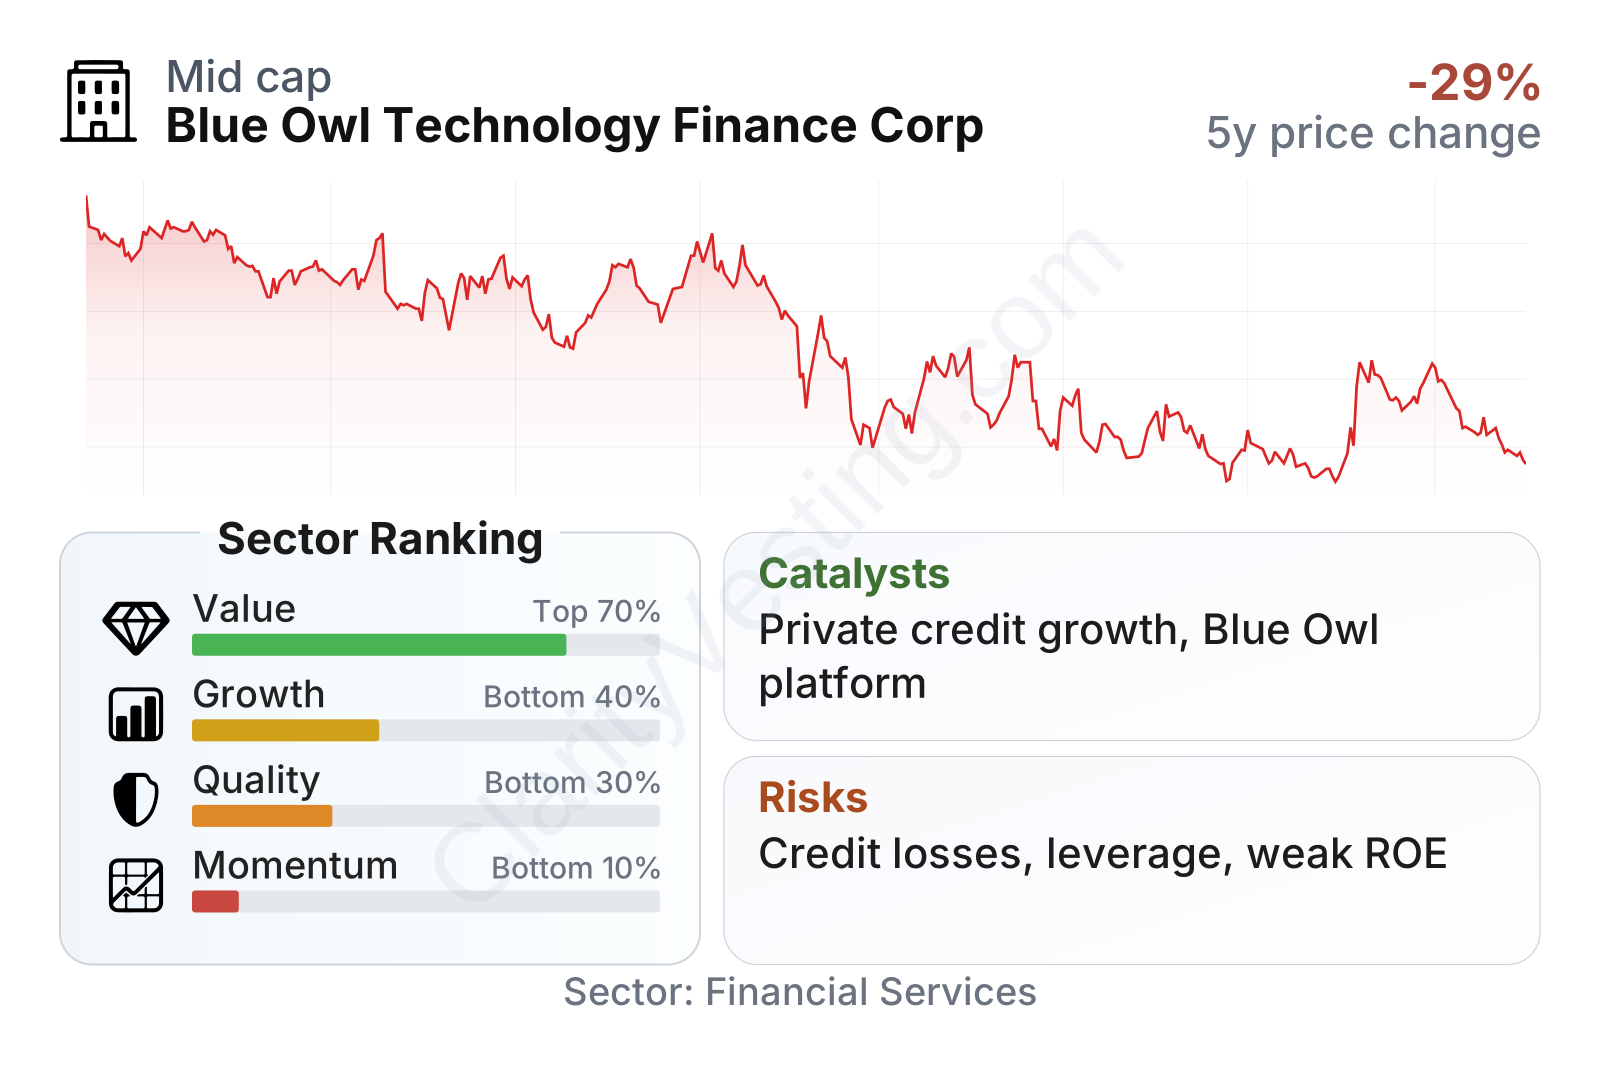
Blue Owl Technology Finance is a mid-sized listed credit vehicle in the financial services sector. The valuation profile looks mixed rather than uniformly cheap or expensive. Its earnings multiple is close to the sector median, while its price-to-book ratio is materially below the sector norm. The dividend yield is unusually high compared with peers, but that headline number should be read together with profitability, leverage, and the recent share-price decline.
On growth, the company appears below the sector median overall. Recent revenue growth has remained positive, but longer-term revenue per share expansion has been weak. One brighter point is dividend growth over the last five years, which has been notably stronger than the sector median. On quality, the picture is also mixed: profit margin is solid and asset returns remain above the sector median, but return on equity has fallen well below sector norms and leverage is elevated. Market performance has been weak, with the shares trailing the sector over both six and twelve months.
Growth
The company operates in a part of the market that still has an attractive long-term backdrop. Private credit has expanded as banks have become more selective lenders, especially to venture-backed, sponsor-backed, and specialized growth companies. Technology and life sciences borrowers often need customized financing, and lenders with sector expertise can benefit from that complexity. That broad industry direction supports continued demand for non-bank lenders such as Blue Owl Technology Finance.
Its strategy also makes sense for future growth, at least in principle. The company is focused on areas where underwriting knowledge, sponsor relationships, and access to deal flow can create a barrier to entry. Being connected to Blue Owl’s larger alternative asset management platform may help it originate loans, refinance existing borrowers, and maintain visibility into market conditions. This platform advantage is important because private credit is becoming more competitive.
That said, growth should not be judged by sector enthusiasm alone. Earnings momentum has cooled after the strong 2025 result, and the recent quarterly annualized earnings run rate looks lower than the prior year. This suggests that repayments, yield normalization, credit marks, or funding costs may be limiting short-term expansion even though the long-term addressable market remains attractive.
Book value per share has generally held up over time and improved meaningfully by the end of 2025 compared with prior years. For a lender, book value matters because it gives a rough sense of whether the portfolio is preserving economic value after dividends, credit events, and market adjustments. A stable-to-rising book value can support the case that underwriting has been disciplined, even if recent earnings have moderated.
A relevant recent opportunity is the continued institutionalization of private credit and the growing need for specialized financing outside traditional banks. For Blue Owl Technology Finance, that creates room to expand with sponsor-backed borrowers and existing portfolio relationships. If interest rates stay at levels that preserve attractive loan spreads, recurring income from new deployments can remain supportive, provided credit losses stay controlled.
Risks
This article is for informational purposes only and does not constitute financial advice. Some content is AI-generated. See Disclaimer


