Stock Analysis · Orient Overseas International Ltd (OROVY)
Overview
Orient Overseas International Ltd is a Hong Kong-based shipping and logistics group best known for its container transportation business through OOCL, or Orient Overseas Container Line. In simple terms, the company moves goods in large containers across global trade routes and also provides related logistics services that help customers manage cargo beyond the ocean voyage itself.
The business is heavily centered on container shipping. Public company materials show that liner and logistics activities account for nearly all revenue, with the shipping segment overwhelmingly dominant and logistics representing a much smaller contribution. Based on the company’s recent annual reporting structure, the revenue mix can be summarized as follows:
- Container transport and related activities: about 95% to 98% of revenue. This includes ocean freight services on major East-West and intra-Asia trade lanes, vessel capacity management, and related surcharges and handling activity.
- Logistics and terminal-related activities: about 2% to 5% of revenue. This includes supply chain services, inland transportation coordination, warehousing support, and some terminal-related contributions.
That concentration matters. It means Orient Overseas is mostly a direct play on global container shipping rates, cargo volumes, and fleet efficiency. The company’s earnings can therefore move sharply when freight markets tighten or soften. Over the last several years, revenue and profit surged during the industry boom, then normalized, and later improved again as pricing and trade conditions stabilized. The broad pattern visible in the business is a highly cyclical top line paired with unusually strong profitability and balance-sheet discipline for a shipping company.
The flow of revenue and profit over recent years highlights this cyclicality clearly: 2021 and 2022 were exceptional, 2023 dropped sharply as freight rates normalized, and 2024 showed a meaningful rebound. Even after that normalization, the company remained profitable, which suggests its cost structure and network quality are stronger than many weaker operators in the sector.
Key Figures
| Metric | Value | Sector ⓘ |
|---|---|---|
| Date | Oct 24, 2026 | |
| Context | ||
| Sector | Industrials | |
| Industry | Marine Shipping | |
| Market Cap ⓘ | $12.92B | |
| Beta ⓘ | 1.28 | |
Value (Cheapness) | ||
| P/E Ratio ⓘ | 10.03 | 22.29 |
| P/B Ratio ⓘ | 0.93 | 1.98 |
| FCF Yield ⓘ | 17.32% | 6.26% |
| Dividend Yield ⓘ | 4.94% | 1.92% |
| EBIT / EV ⓘ | 50.48% | 4.83% |
| PEG ⓘ | N/A | |
Growth (Business expansion) | ||
| Revenue Growth ⓘ | 6.10% | 9.30% |
| RPS Growth (5Y CAGR) ⓘ | -13.40% | 7.76% |
| EPS Growth (5Y CAGR) ⓘ | 63.67% | -13.17% |
| BVPS Growth (5Y CAGR) ⓘ | 7.79% | 6.13% |
| Margin Growth (5Y Trend) ⓘ | -32.00% | 0.74% |
| FCF Growth (5Y CAGR) ⓘ | -55.91% | 10.79% |
| DPS Growth (5Y CAGR) ⓘ | -22.74% | 9.41% |
Quality (Business durability) | ||
| ROIC (Latest) ⓘ | N/A | 10.75% |
| ROA (Latest) ⓘ | 22.15% | 5.41% |
| ROIC (5Y Median) ⓘ | 21.26% | 9.37% |
| ROA (5Y Median) ⓘ | 15.44% | 4.95% |
| Net Debt / EBIT (Latest) ⓘ | -0.10 | 2.04 |
| Net Debt / EBIT (5Y Median) ⓘ | -1.57 | 2.27 |
| Net Debt / EBITDA (Latest) ⓘ | -0.07 | 1.39 |
| Net Debt / Assets ⓘ | -2.17% | 19.27% |
| EBITDA / Interest ⓘ | 172.30 | 9.58 |
| Operating Margin (Latest) ⓘ | 17.99% | 10.49% |
| Operating Margin (5Y Median) ⓘ | 24.62% | 10.30% |
| Debt to Equity (Latest) ⓘ | 9.17% | 64.82% |
| Profit Margin (Latest) ⓘ | 12.85% | 6.67% |
| Free Cash Flow (Latest) ⓘ | $2.24B | |
Momentum (Price trend) | ||
| 3Y Return ⓘ | +90.30% | +67.77% |
| 12M Return (excl. last month) ⓘ | +17.02% | +12.05% |
| 6M Return ⓘ | +10.65% | 0.00% |
| Price vs. 200-Day MA ⓘ | +31.23% | +0.67% |
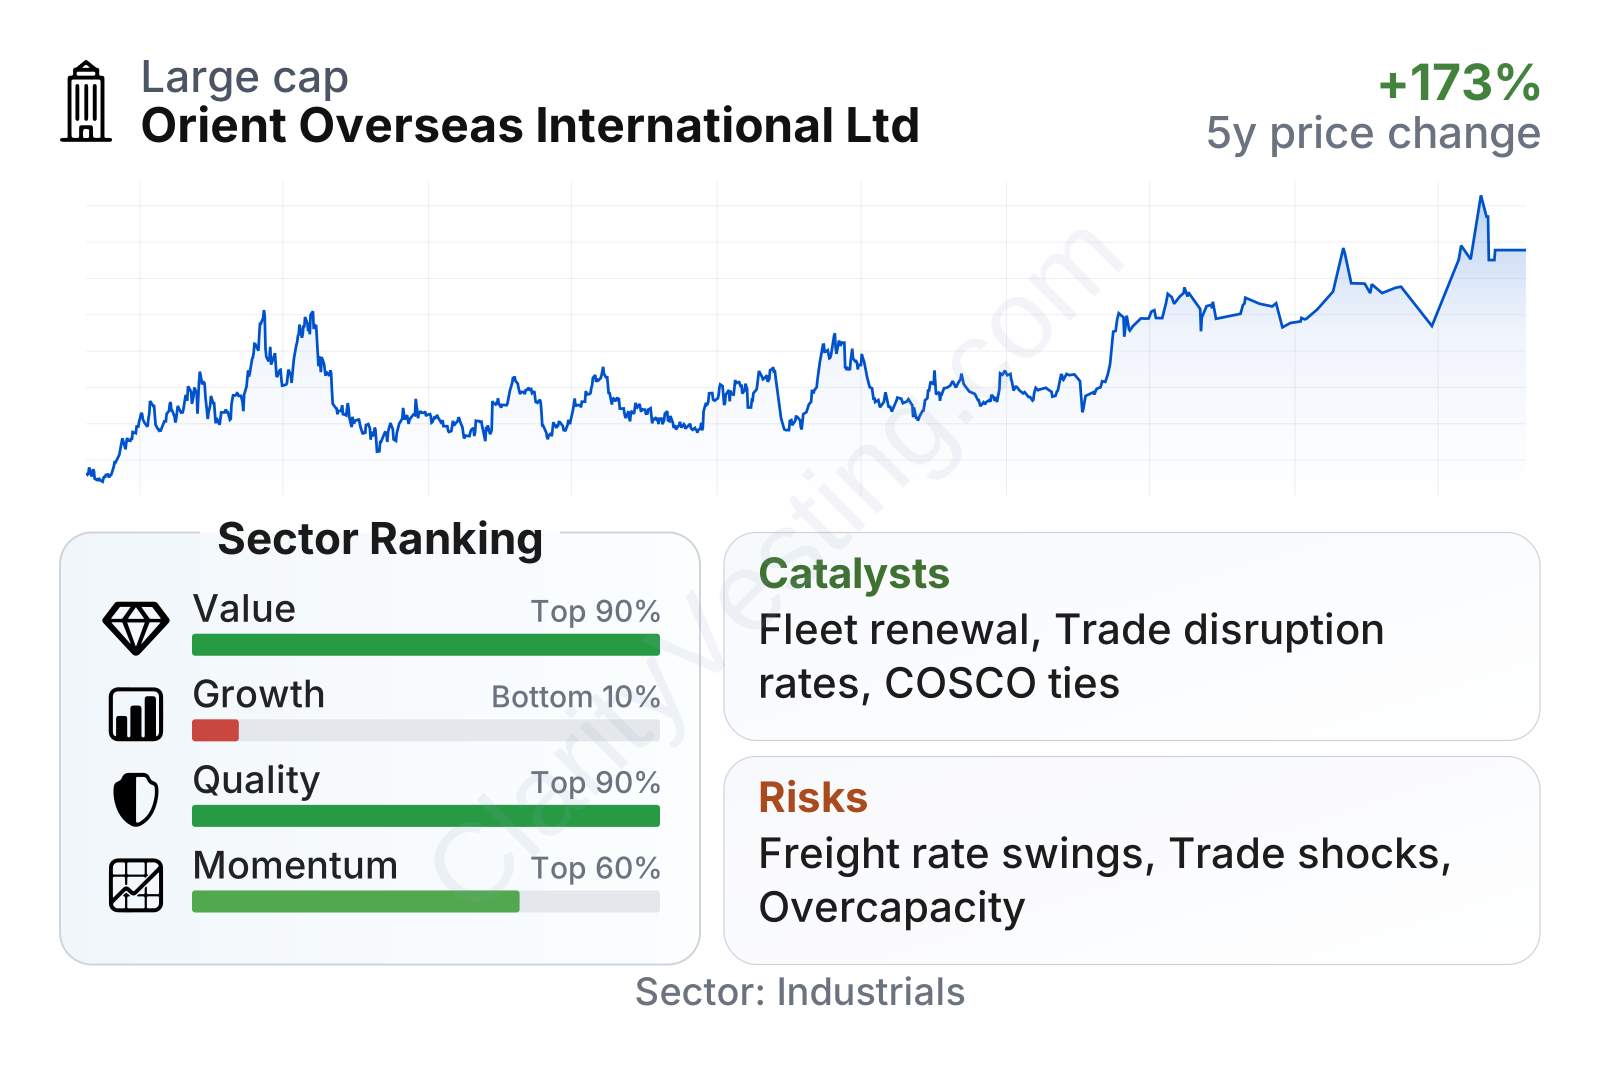
Orient Overseas stands out for financial strength and profitability rather than broad-based growth. On valuation measures, it screens cheaper than the typical industrial company in its sector, with a lower price-to-earnings ratio, a price-to-book ratio below the sector median, and a free cash flow yield that is well above average. On quality, the company is also strong: returns on assets and long-term returns on invested capital are high, leverage is very low, and interest coverage is exceptionally comfortable. The weaker area is growth, where longer-term revenue and cash flow trends remain distorted by the post-boom shipping normalization. Momentum has still been favorable, with the shares outperforming the sector over several time frames.
The stock price history also shows how the market has reassessed the company over time. Shares have risen materially since 2021, but that path has not been smooth. That fits the nature of marine shipping, where sentiment can swing quickly as investors react to freight rates, global trade expectations, and geopolitical disruptions.
Growth
Orient Overseas operates in a sector that should remain structurally important over the long run because global trade still relies heavily on containerized shipping. That does not make it a steady-growth industry. Marine shipping tends to expand in waves, driven by world trade, fleet supply, port congestion, and route disruptions. For long-term analysis, the key question is less about constant growth and more about whether the company can preserve profitability through the cycle while positioning itself for the next upturn.
The company’s strategy broadly makes sense in that context. OOIL has emphasized fleet modernization, cost efficiency, digital tools, and service reliability through OOCL. It has also benefited from being part of the COSCO Shipping group ecosystem, which gives it scale advantages in procurement, network coordination, and customer reach. This does not eliminate cyclicality, but it can improve resilience versus smaller independent carriers.
A major industry catalyst has been continued supply-chain friction on key trade lanes, especially where rerouting and congestion tighten effective vessel capacity. When global shipping networks become less efficient, carriers with established routes and disciplined capacity management can see stronger freight pricing. A second catalyst is fleet renewal: newer ships can improve fuel efficiency and help the company stay competitive as environmental standards tighten. A third support point is the company’s very strong cash generation, which leaves room to fund vessels, maintain operations through weaker markets, and potentially keep shareholder distributions meaningful when earnings allow.
Recent company communications and annual disclosures also indicate ongoing investment in dual-fuel and more efficient vessels. That matters because the shipping industry is moving toward stricter emissions compliance, and carriers that prepare earlier may face a smoother transition than those relying on older fleets. In a business where operating costs and asset quality matter, that is a practical growth and competitiveness lever rather than just a branding exercise.
Risks
This article is for informational purposes only and does not constitute financial advice. Some content is AI-generated. See Disclaimer


