Stock Analysis · Oruka Therapeutics Inc (ORKA)
Overview
Oruka Therapeutics is a clinical-stage biotechnology company focused on developing treatments for inflammatory skin diseases. Its lead programs are aimed at psoriasis and other immune-related dermatology conditions, an area where patients and physicians continue to look for drugs that work quickly, last longer, and are easier to dose. The company does not operate as a mature commercial drugmaker today; it is still in the development stage, so its value depends mainly on the future potential of its pipeline rather than current product sales.
At this stage, Oruka’s revenue profile is unusually simple: there is effectively no recurring operating revenue. The business is being funded primarily through cash raised from the capital markets rather than from product sales or large licensing streams. That is common for early-stage biotech companies, but it also means the company’s economics are driven by research progress, clinical milestones, and financing conditions rather than day-to-day commercial performance.
The main economic sources tied to the business currently look like this:
- Product revenue: approximately 0%. Oruka does not appear to have approved commercial products generating meaningful sales.
- Collaboration, licensing, or milestone revenue: approximately 0% in the most recent annual period, based on available annual financial reporting.
- Financing and cash reserves: this is not revenue in the accounting sense, but it is the practical funding source supporting operations while the pipeline advances.
The expense mix is more informative than the revenue mix. Research and development is clearly the dominant use of cash, and that spending increased sharply over the last two years as the pipeline expanded. General and administrative costs also rose, but much less than research spending, which suggests the company is still primarily allocating resources toward drug development rather than building a large commercial infrastructure too early.
The financial flow highlights a business with minimal revenue and a cost base led by research and development. Losses widened materially as the company accelerated pipeline spending, which is typical for a biotech moving from a quieter preclinical phase into more active development.
Key Figures
| Metric | Value | Sector ⓘ |
|---|---|---|
| Date | Oct 24, 2026 | |
| Context | ||
| Sector | Healthcare | |
| Industry | Biotechnology | |
| Market Cap ⓘ | $5.29B | |
| Beta ⓘ | -0.11 | |
Value (Cheapness) | ||
| P/E Ratio ⓘ | N/A | 25.42 |
| P/B Ratio ⓘ | 4.58 | 3.08 |
| FCF Yield ⓘ | -1.91% | 3.12% |
| Dividend Yield ⓘ | N/A | 1.85% |
| EBIT / EV ⓘ | -2.79% | 0.56% |
| PEG ⓘ | N/A | |
Growth (Business expansion) | ||
| Revenue Growth ⓘ | N/A | 7.50% |
| RPS Growth (5Y CAGR) ⓘ | N/A | 8.60% |
| EPS Growth (5Y CAGR) ⓘ | N/A | -17.73% |
| BVPS Growth (5Y CAGR) ⓘ | 29.57% | 3.72% |
| Margin Growth (5Y Trend) ⓘ | N/A | -0.57% |
| FCF Growth (5Y CAGR) ⓘ | N/A | 0.96% |
| DPS Growth (5Y CAGR) ⓘ | N/A | 6.69% |
Quality (Business durability) | ||
| ROIC (Latest) ⓘ | -17.36% | 3.17% |
| ROA (Latest) ⓘ | -16.12% | 2.98% |
| ROIC (5Y Median) ⓘ | N/A | 4.56% |
| ROA (5Y Median) ⓘ | -23.84% | 1.87% |
| Net Debt / EBIT (Latest) ⓘ | N/A | 1.34 |
| Net Debt / EBIT (5Y Median) ⓘ | N/A | 1.86 |
| Net Debt / EBITDA (Latest) ⓘ | N/A | 1.00 |
| Net Debt / Assets ⓘ | -23.34% | 5.06% |
| EBITDA / Interest ⓘ | N/A | 9.55 |
| Operating Margin (Latest) ⓘ | N/A | 9.25% |
| Operating Margin (5Y Median) ⓘ | N/A | 7.33% |
| Debt to Equity (Latest) ⓘ | 0.23% | 26.68% |
| Profit Margin (Latest) ⓘ | N/A | 3.34% |
| Free Cash Flow (Latest) ⓘ | -$101.15M | |
Momentum (Price trend) | ||
| 3Y Return ⓘ | +535.04% | +51.61% |
| 12M Return (excl. last month) ⓘ | +451.31% | +19.90% |
| 6M Return ⓘ | +16.46% | +10.10% |
| Price vs. 200-Day MA ⓘ | +20.52% | +6.44% |
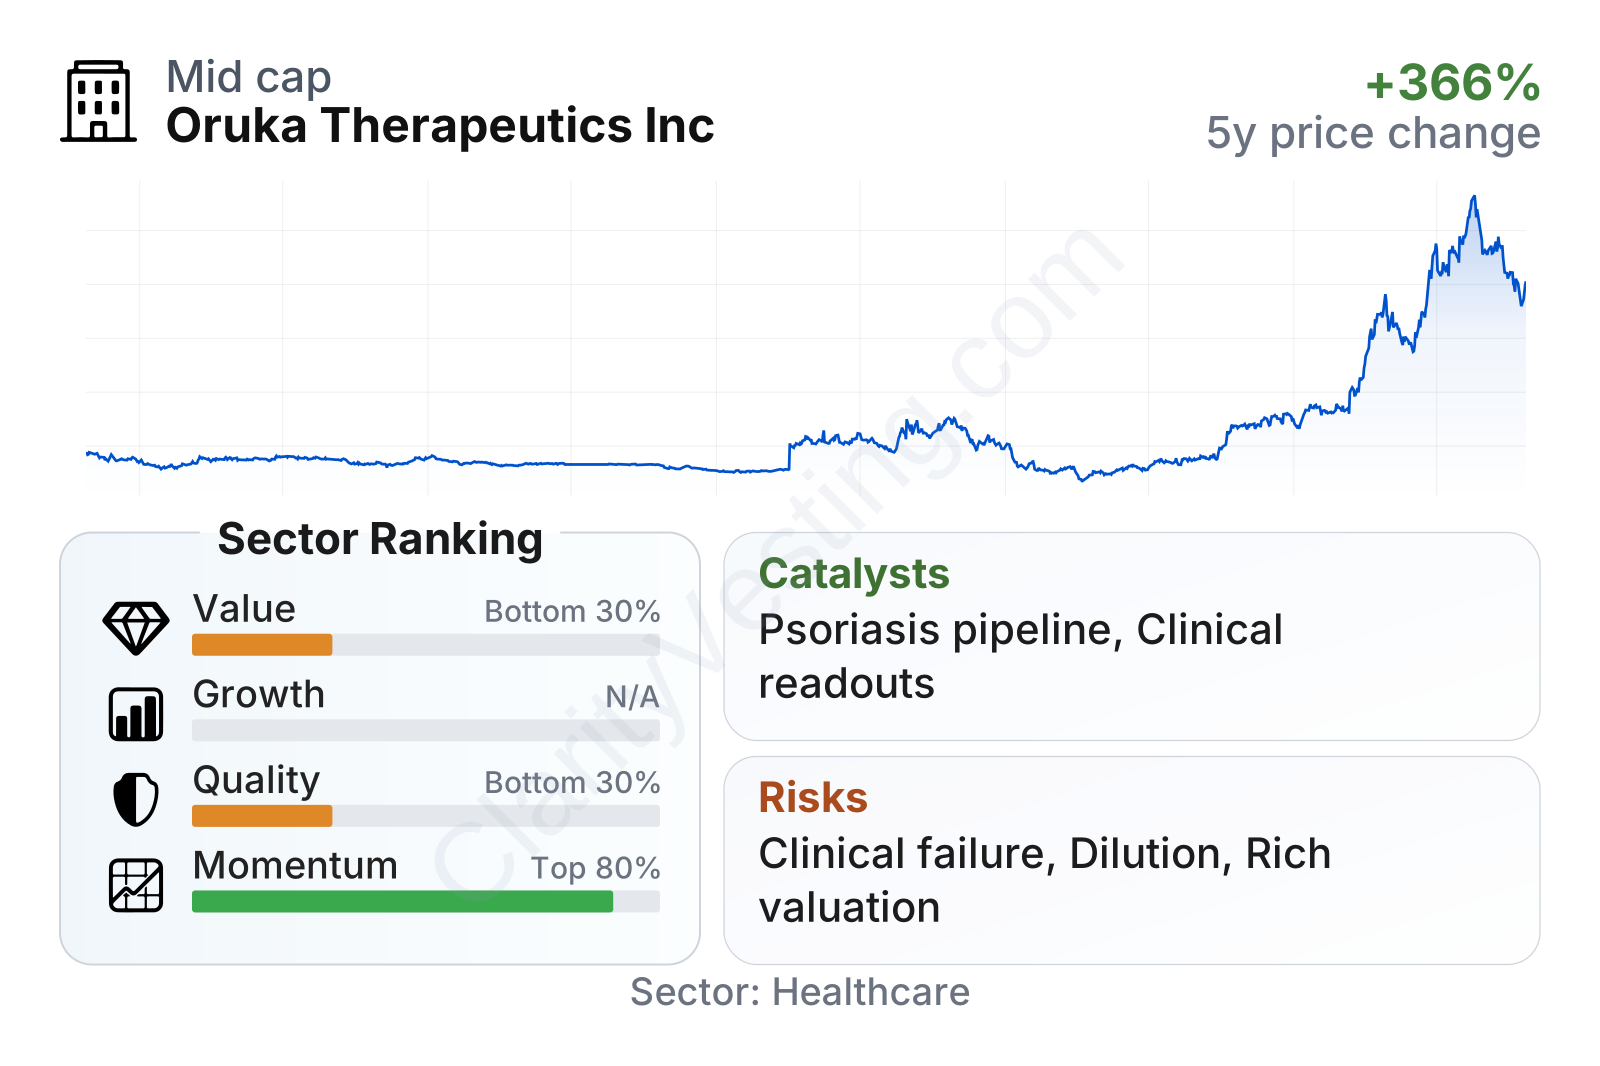
Oruka is a mid-sized biotech by market value, but it still has the financial profile of a development-stage company rather than an established pharmaceutical business. The stock’s momentum has been exceptionally strong versus most healthcare peers, reflecting a major re-rating by the market. By contrast, value and quality metrics rank weakly because the company is not yet profitable, has negative free cash flow, and has no meaningful revenue base. One notable positive is the balance sheet: leverage is extremely low compared with the sector, which reduces one important source of financial risk even though operating losses remain significant.
Growth
Oruka operates in a large and still growing market. Inflammatory dermatology, especially psoriasis, remains an attractive area for drug development because it combines chronic treatment demand, high pricing power for effective biologics, and room for differentiation on dosing convenience, durability, safety, and speed of response. Even though several strong medicines already exist, the market continues to reward products that can improve how often patients need treatment or how reliably they stay clear over time.
The company’s strategy appears coherent for that opportunity. Rather than spreading resources across many unrelated areas, Oruka is concentrating on a focused set of dermatology assets. That specialization can help in trial design, physician targeting, and eventual commercialization if the programs work. In small biotech, focus matters because management bandwidth and capital are limited.
A major catalyst is clinical execution. For companies like Oruka, value creation usually comes in steps: preclinical progress, trial initiations, early human data, proof-of-concept results, and then larger registrational studies or partnerships. If the company can show that its candidates have competitive efficacy with more convenient dosing or better durability, that could meaningfully improve its strategic position in a crowded but lucrative market. Another important opportunity is business development: strong data in dermatology can attract larger pharmaceutical partners that already have global commercial platforms.
Cash generation remains negative and has moved further below zero as development activity increased. That is not surprising for a company at this stage, but it confirms that growth is currently being purchased through cash burn rather than funded by internal operations. For long-term analysis, the key question is whether today’s spending is building assets with enough differentiation to justify that burn.
Recent market behavior suggests that investors have become much more optimistic about that possibility. The stock price has climbed dramatically from 2025 into 2026, which usually signals rising expectations around the pipeline, portfolio quality, or future milestones. That kind of move can reflect genuine strategic progress, but it also raises the bar for upcoming clinical results.
Risks
This article is for informational purposes only and does not constitute financial advice. Some content is AI-generated. See Disclaimer


