Stock Analysis · Oric Pharmaceuticals Inc (ORIC)
Overview
ORIC Pharmaceuticals is a clinical-stage biotechnology company focused on cancer medicines. Its goal is to overcome one of the biggest problems in oncology: tumors often stop responding to treatment over time because they develop resistance. ORIC is building drug candidates designed either to address that resistance directly or to improve how existing cancer treatments work in patients whose disease has become harder to treat.
At this stage, the business is still centered on research and development rather than commercial sales. The company’s pipeline has included programs aimed at hormone-driven cancers and other solid tumors, with value depending mainly on clinical progress, partnerships, and eventual regulatory success rather than current product revenue.
Based on recent filings, ORIC’s revenue base remains very limited and does not yet reflect a marketed drug portfolio. The revenue mix is therefore simple:
- Product revenue: approximately 0%. ORIC does not currently appear to have approved products generating recurring commercial sales.
- Collaboration, licensing, or other revenue: a small and irregular amount when recognized, but not yet a stable operating foundation.
- Cash and investments: not revenue, but an essential funding source for operations while the pipeline is still in development.
The financial structure reflects this model clearly: operating expenses are dominated by research and development, while administrative spending is much smaller. Over the past several years, annual operating expenses have climbed from roughly the high tens of millions of dollars to around $140 million, with research and development consistently representing the largest share. That pattern is typical for a biotech company advancing multiple cancer programs but also shows that the current investment case depends far more on future drug data than on present-day business earnings.
The expense profile shows a company still firmly in build-out mode. Research spending has expanded materially over time and remains the core use of capital, while revenue has stayed near zero. That is consistent with a pipeline-driven biotech model: progress in the clinic matters much more than traditional sales trends for now.
Key Figures
| Metric | Value | Sector ⓘ |
|---|---|---|
| Date | Oct 03, 2026 | |
| Context | ||
| Sector | Healthcare | |
| Industry | Biotechnology | |
| Market Cap ⓘ | $1.40B | |
| Beta ⓘ | 0.99 | |
Value (Cheapness) | ||
| P/E Ratio ⓘ | N/A | 24.06 |
| P/B Ratio ⓘ | 3.55 | 3.08 |
| FCF Yield ⓘ | -8.05% | 3.07% |
| Dividend Yield ⓘ | N/A | 2.05% |
| EBIT / EV ⓘ | -12.89% | 0.63% |
| PEG ⓘ | N/A | |
Growth (Business expansion) | ||
| Revenue Growth ⓘ | N/A | 7.50% |
| RPS Growth (5Y CAGR) ⓘ | N/A | 8.70% |
| EPS Growth (5Y CAGR) ⓘ | -26.21% | -18.20% |
| BVPS Growth (5Y CAGR) ⓘ | -11.67% | 3.95% |
| Margin Growth (5Y Trend) ⓘ | N/A | -0.58% |
| FCF Growth (5Y CAGR) ⓘ | N/A | 0.88% |
| DPS Growth (5Y CAGR) ⓘ | N/A | 6.80% |
Quality (Business durability) | ||
| ROIC (Latest) ⓘ | -28.32% | 3.29% |
| ROA (Latest) ⓘ | -33.58% | 3.02% |
| ROIC (5Y Median) ⓘ | -32.19% | 4.75% |
| ROA (5Y Median) ⓘ | -37.79% | 1.93% |
| Net Debt / EBIT (Latest) ⓘ | N/A | 1.33 |
| Net Debt / EBIT (5Y Median) ⓘ | N/A | 1.83 |
| Net Debt / EBITDA (Latest) ⓘ | N/A | 0.99 |
| Net Debt / Assets ⓘ | -8.44% | 5.33% |
| EBITDA / Interest ⓘ | N/A | 9.63 |
| Operating Margin (Latest) ⓘ | N/A | 9.25% |
| Operating Margin (5Y Median) ⓘ | N/A | 7.80% |
| Debt to Equity (Latest) ⓘ | 0.87% | 28.99% |
| Profit Margin (Latest) ⓘ | N/A | 3.60% |
| Free Cash Flow (Latest) ⓘ | -$112.42M | |
Momentum (Price trend) | ||
| 3Y Return ⓘ | +112.56% | +37.48% |
| 12M Return (excl. last month) ⓘ | +26.00% | +20.85% |
| 6M Return ⓘ | +67.49% | +9.73% |
| Price vs. 200-Day MA ⓘ | +15.68% | +4.69% |
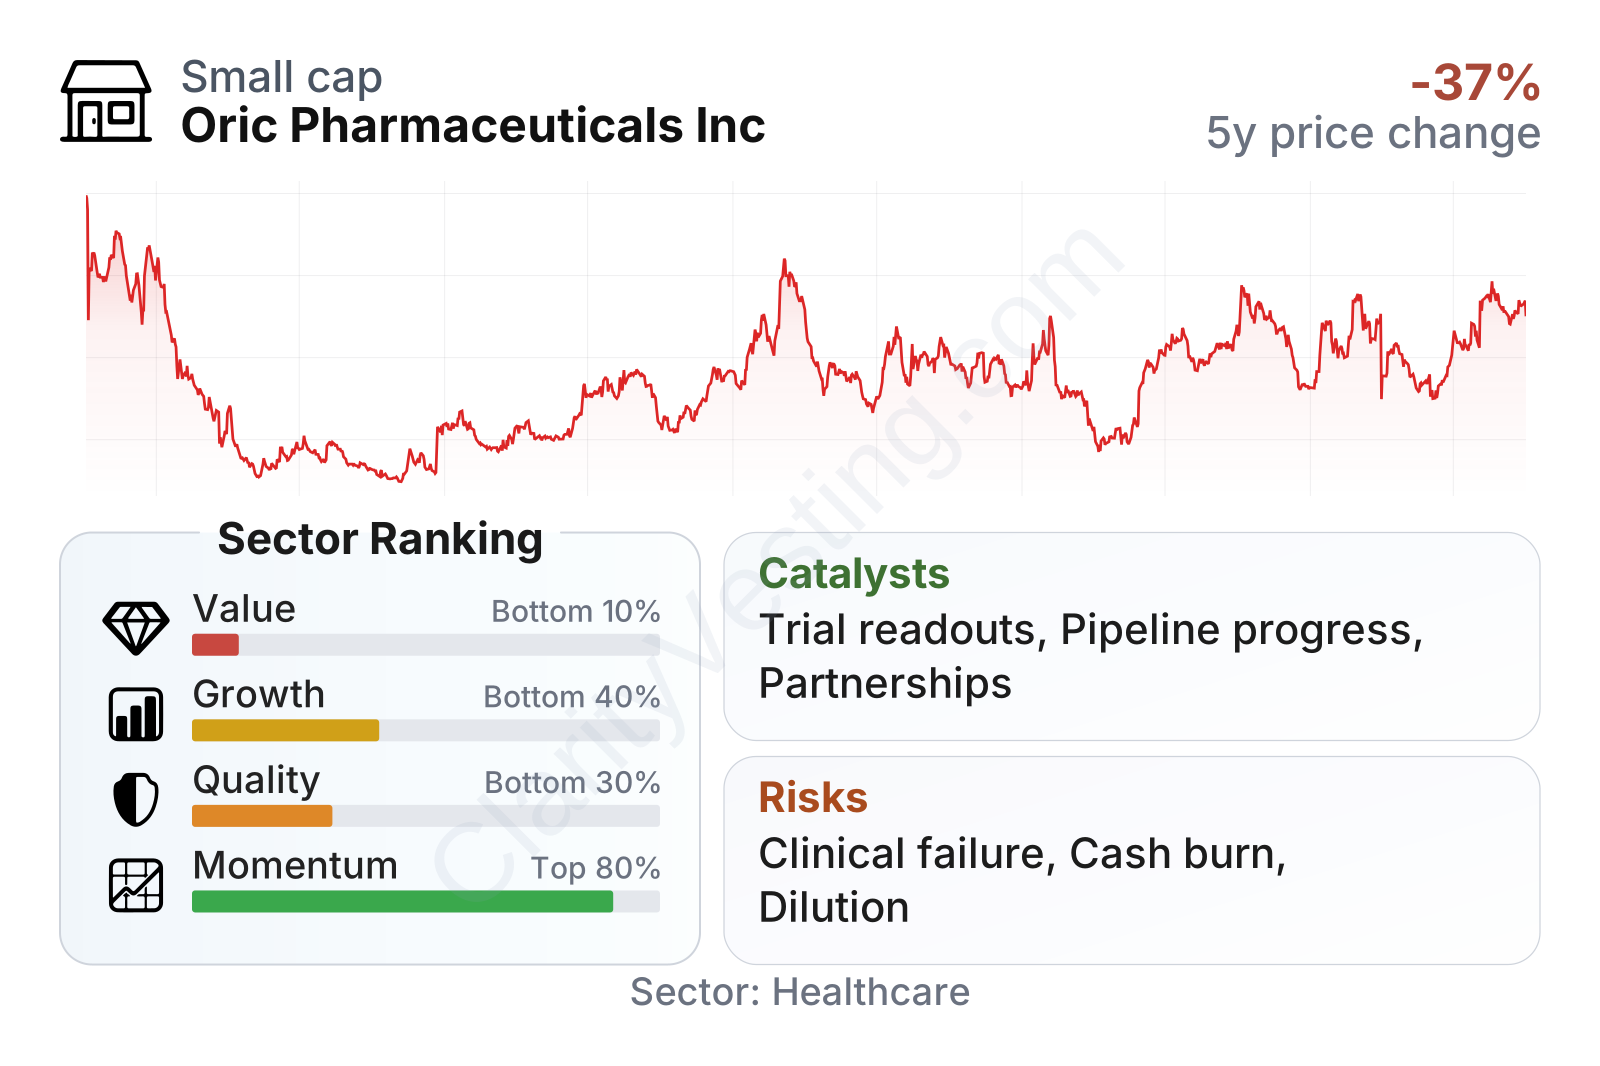
ORIC is a small-cap biotech company with a market value around the low single-digit billions of dollars and a stock volatility level close to the broader market. The most striking feature in the metrics is the contrast between market performance and operating fundamentals. Share-price momentum has been better than much of the healthcare sector over multi-year periods, but value, quality, and growth factors still rank weakly versus sector medians because the company remains pre-profit and has not yet established recurring revenue.
The balance sheet is a relative strength. Debt levels are extremely low compared with the sector, which matters for a company that is still consuming cash. On the other hand, profitability measures, returns on capital, and free cash flow remain well below sector norms, which is expected for a clinical-stage biotech but still important when considering long-term risk.
Growth
ORIC operates in one of the most active parts of healthcare: oncology drug development. Cancer remains a major long-term growth area for the pharmaceutical industry because medical need is high, treatment standards continue to evolve, and successful therapies can become very valuable. Within that large market, ORIC is targeting treatment resistance, a problem that is medically important and commercially meaningful because resistance often limits the durability of otherwise effective therapies.
The strategy makes sense in principle. Rather than trying to compete broadly across all cancer types, ORIC is concentrating on a specific pain point in cancer care and on biomarker-driven approaches that can potentially support more precise patient selection. In biotech, that kind of focus can be an advantage if the science is differentiated and if trial results show clear benefit in defined patient groups.
The main growth catalysts are clinical. For a company at ORIC’s stage, meaningful upside usually comes from favorable trial readouts, expansion into additional indications, regulatory progress, and partnership activity with larger drug developers. Public company updates in 2026 have continued to center on pipeline advancement and cash runway, reinforcing that the next major inflection points are tied to development milestones rather than current financial performance.
Cash burn remains substantial, with trailing free cash flow still deeply negative, although the most recent reading suggests the pace may have stabilized somewhat after worsening over the prior few years. That does not create growth by itself, but it does help frame how much time management may have to deliver meaningful clinical data before needing additional financing.
Risks
This article is for informational purposes only and does not constitute financial advice. Some content is AI-generated. See Disclaimer


