Stock Analysis · Old Republic International Corp (ORI)
Overview
Old Republic International Corp is a U.S. insurance group focused mainly on property & casualty insurance and title insurance. In simple terms, it collects premiums from policyholders, invests part of that money, and aims to earn a profit by pricing risk carefully over long periods. The company has operated for decades and is known for emphasizing underwriting discipline rather than chasing rapid expansion.
Its business is organized around two core segments. The larger one is General Insurance, which covers commercial auto, workers’ compensation, general liability, inland marine, and a range of specialty commercial lines. The second is Title Insurance, which supports residential and commercial real estate transactions by insuring property titles and related settlement services. Investment income is also an important earnings contributor, as insurers typically invest their float in bonds and other income-producing assets.
Based on the company’s recent reporting structure, the main sources of revenue are approximately:
- General Insurance: about 65% to 75% of consolidated operating revenue. This includes specialty property & casualty products sold largely to commercial customers.
- Title Insurance: about 20% to 30%. This includes title policies, escrow, and other real-estate-related transaction services.
- Net investment income and other: about 5% to 10%. This mainly reflects returns from the company’s investment portfolio and smaller corporate items.
That mix matters because it gives Old Republic exposure to two different insurance engines: recurring commercial insurance demand and cyclical real-estate-linked title activity. It also means results can be steadier than a single-line insurer, although not immune to swings in claims costs or housing activity.
The long-term revenue path has not been perfectly smooth, but the company has rebuilt earnings after weaker periods. Revenue moved back toward the $9 billion range by 2025, while operating income and net income also improved from the softer 2022–2023 period. That pattern suggests the business remains capable of recovering profitability when underwriting conditions and investment income improve.
Over the last several years, revenue and profit have shown some volatility, which is normal for an insurer exposed to claims cycles and title activity. The more important takeaway is that profitability recovered after the 2022–2023 dip, and operating earnings appear stronger again than they were at that low point.
Key Figures
| Metric | Value | Sector ⓘ |
|---|---|---|
| Date | Oct 17, 2026 | |
| Context | ||
| Sector | Financial Services | |
| Industry | Insurance - Property & Casualty | |
| Market Cap ⓘ | $9.27B | |
| Beta ⓘ | 0.59 | |
Value (Cheapness) | ||
| P/E Ratio ⓘ | 8.44 | 12.26 |
| P/B Ratio ⓘ | 1.57 | 1.23 |
| FCF Yield ⓘ | 13.80% | 10.40% |
| Dividend Yield ⓘ | 3.17% | 3.02% |
| EBIT / EV ⓘ | 13.68% | 8.14% |
| PEG ⓘ | 1.39 | |
Growth (Business expansion) | ||
| Revenue Growth ⓘ | 13.40% | 9.35% |
| RPS Growth (5Y CAGR) ⓘ | 4.30% | 12.19% |
| EPS Growth (5Y CAGR) ⓘ | -7.62% | -9.53% |
| BVPS Growth (5Y CAGR) ⓘ | -25.38% | 4.99% |
| Margin Growth (5Y Trend) ⓘ | -5.21% | -3.86% |
| FCF Growth (5Y CAGR) ⓘ | -2.94% | 4.81% |
| DPS Growth (5Y CAGR) ⓘ | -1.69% | 8.79% |
Quality (Business durability) | ||
| ROIC (Latest) ⓘ | 15.35% | 9.49% |
| ROE (Latest) ⓘ | 18.26% | 13.90% |
| ROA (Latest) ⓘ | 3.68% | 1.55% |
| ROIC (5Y Median) ⓘ | 13.57% | 7.86% |
| ROE (5Y Median) ⓘ | 9.52% | 12.17% |
| ROA (5Y Median) ⓘ | 3.14% | 1.30% |
| Net Debt / EBIT (Latest) ⓘ | 1.23 | 0.96 |
| Net Debt / EBIT (5Y Median) ⓘ | 1.06 | 0.73 |
| Net Debt / EBITDA (Latest) ⓘ | 1.24 | 0.92 |
| Operating Margin (Latest) ⓘ | 15.70% | 22.30% |
| Operating Margin (5Y Median) ⓘ | 13.80% | 24.63% |
| Debt to Equity (Latest) ⓘ | 37.61% | 58.56% |
| Profit Margin (Latest) ⓘ | 11.72% | 26.57% |
| Free Cash Flow (Latest) ⓘ | $1.28B | |
Momentum (Price trend) | ||
| 3Y Return ⓘ | +74.04% | +88.33% |
| 12M Return (excl. last month) ⓘ | +12.26% | +19.38% |
| 6M Return ⓘ | -4.70% | +4.75% |
| Price vs. 200-Day MA ⓘ | -3.65% | +3.50% |
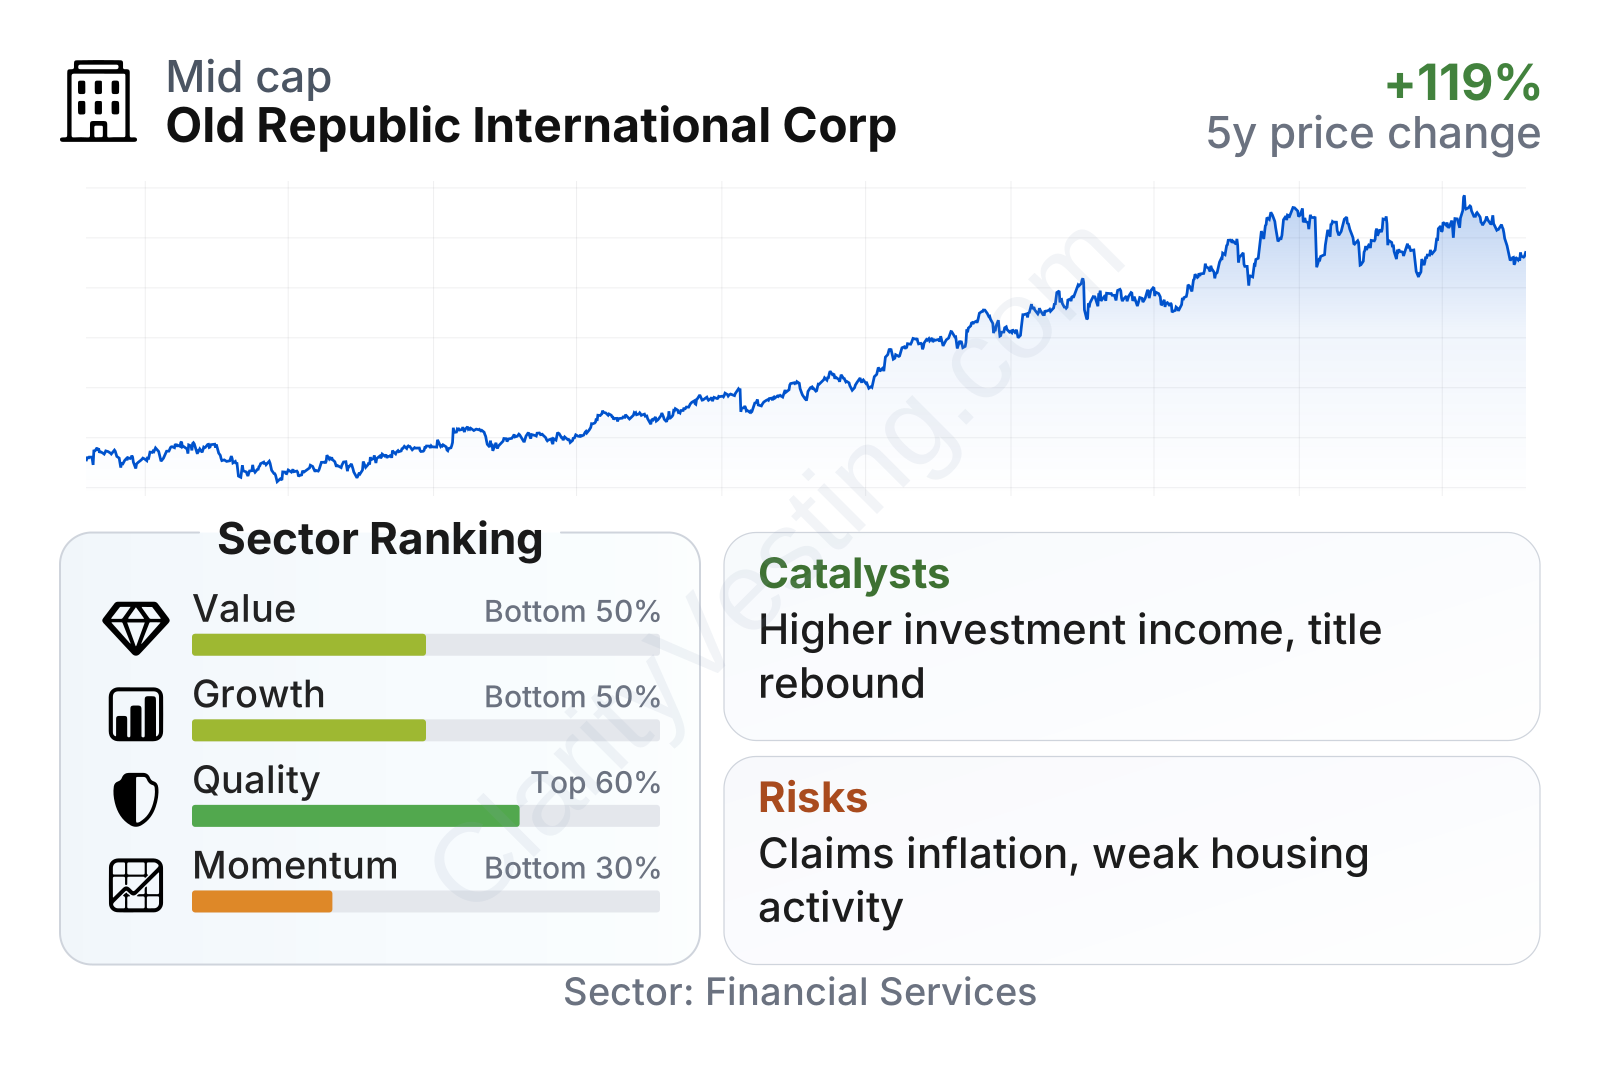
Old Republic is a mid-to-large insurance company by market value, and its shares have climbed strongly over the last few years, rising from the high teens in 2021 to around the low 40s in 2026. Even after that run, its earnings multiple remains below the sector median, while free cash flow yield and dividend yield compare favorably. The quality profile is solid, with returns on capital and assets above many sector peers, although growth and recent share-price momentum rank weaker than the broader financial sector.
The overall picture is a company that looks operationally respectable and financially sound, but not one screening as a high-growth name. The lower beta also suggests the stock has historically been less volatile than the broader market, which fits the profile of a mature insurer.
Growth
Old Republic operates in a sector that tends to grow steadily rather than explosively. Property & casualty insurance benefits from ongoing demand because businesses must insure vehicles, employees, liability exposures, and physical assets. Over time, premium growth can also be supported by inflation, because higher repair, medical, and replacement costs usually lead to higher insured values and pricing. Title insurance is more cyclical, but it can rebound meaningfully when housing turnover, refinancing, or commercial real estate transactions recover.
The company’s strategy is sensible for this type of business. Instead of pursuing aggressive expansion, Old Republic has historically focused on specialized underwriting niches, conservative reserving, and consistent capital returns. That does not usually create fast headline growth, but it can support durable profitability through insurance cycles. A major practical catalyst is the interest-rate environment: insurers invest large pools of fixed-income assets, so higher reinvestment yields can lift investment income over time.
Another growth lever is pricing discipline in commercial insurance. If loss trends remain manageable and pricing stays firm, premium growth can translate into better underwriting margins. In title insurance, any broad normalization in U.S. real estate activity could help a segment that has faced a difficult backdrop in recent years.
Earnings per share show a dip from 2021 through 2023, followed by a recovery in 2024 and 2025. That pattern fits an insurer working through less favorable conditions and then rebuilding profitability. It does not point to straight-line growth, but it does suggest earnings resilience.
Book value per share has been uneven over the period, including a sharp reset and then a recovery. For insurers, book value is an important measure because it reflects capital strength and the balance sheet supporting future underwriting. The more recent trend looks firmer than the earlier disruption, but this remains an area to watch closely because valuation in insurance often anchors around book value.
As for recent opportunity signals, the clearest one is continued improvement in profitability combined with still-solid cash generation. If the company can maintain underwriting discipline while benefiting from better investment income and a healthier title market, that combination could support further earnings progress even without rapid expansion.
Risks
This article is for informational purposes only and does not constitute financial advice. Some content is AI-generated. See Disclaimer


