Stock Analysis · Orchid Island Capital Inc (ORC)
Overview
Orchid Island Capital Inc. is a mortgage real estate investment trust, or mortgage REIT. Unlike a traditional property REIT that owns buildings, Orchid Island mainly invests in residential mortgage-backed securities, especially agency securities backed by Fannie Mae, Freddie Mac, or Ginnie Mae. These assets are tied to pools of U.S. home loans, and the government-backed guarantee reduces credit risk on principal and interest. The company’s business model is to earn the spread between the yield on those mortgage assets and its own funding costs, while actively managing interest-rate exposure with borrowing arrangements and hedging instruments.
In practical terms, Orchid Island does not make most of its money from rents or from selling products. Its economics are driven by portfolio income, financing costs, and changes in the value of its mortgage holdings and hedges. That makes results more sensitive to interest rates, prepayment behavior, and capital markets than to the broader consumer economy.
The main economic sources that shape Orchid Island’s results are approximately the following:
- Interest income from Agency RMBS and related investments: the core recurring source of earnings, generated by coupon payments on mortgage-backed securities held in the portfolio.
- Gains or losses on mortgage assets and hedges: a very large swing factor from quarter to quarter, including changes in fair value on securities, derivative hedges, and other portfolio positions.
- Income from structured mortgage positions and related investment activity: a smaller contributor that can supplement portfolio returns depending on market conditions.
- Other income: typically limited, and not a major driver compared with portfolio spread income and valuation changes.
For a mortgage REIT like Orchid Island, percentages by revenue source are not always stable or even very meaningful across years because accounting results can swing sharply with unrealized gains and losses. Recent annual figures suggest that reported total revenue has been dominated by portfolio-related income and mark-to-market effects rather than by diversified operating segments. This is a concentrated business centered on one activity: leveraged investing in residential mortgage securities.
The recent financial flow also shows a sharp rebound from loss-heavy years in 2021-2023 to much stronger reported revenue and net income in 2024-2025. That improvement matters, but it should be read carefully because this industry’s reported earnings can change quickly as rates and asset prices move.
Key Figures
| Metric | Value | Sector ⓘ |
|---|---|---|
| Date | Oct 17, 2026 | |
| Context | ||
| Sector | Real Estate | |
| Industry | REIT - Mortgage | |
| Market Cap ⓘ | $1.02B | |
| Beta ⓘ | 1.60 | |
Value (Cheapness) | ||
| P/E Ratio ⓘ | 3.16 | 17.38 |
| P/B Ratio ⓘ | 0.72 | 0.85 |
| FCF Yield ⓘ | 20.19% | 7.38% |
| Dividend Yield ⓘ | 27.17% | 4.85% |
| EBIT / EV ⓘ | N/A | 3.78% |
| PEG ⓘ | N/A | |
Growth (Business expansion) | ||
| Revenue Growth ⓘ | 1003.10% | 5.30% |
| RPS Growth (5Y CAGR) ⓘ | N/A | 6.02% |
| EPS Growth (5Y CAGR) ⓘ | -48.24% | -11.37% |
| BVPS Growth (5Y CAGR) ⓘ | -23.79% | 0.45% |
| Margin Growth (5Y Trend) ⓘ | -954.47% | -0.22% |
| FCF Growth (5Y CAGR) ⓘ | 5.71% | 5.40% |
| DPS Growth (5Y CAGR) ⓘ | -21.94% | 5.02% |
Quality (Business durability) | ||
| ROIC (Latest) ⓘ | N/A | 5.69% |
| ROE (Latest) ⓘ | 19.37% | 7.56% |
| ROA (Latest) ⓘ | 2.20% | 2.85% |
| ROIC (5Y Median) ⓘ | N/A | 4.22% |
| ROE (5Y Median) ⓘ | -8.63% | 6.03% |
| ROA (5Y Median) ⓘ | -0.96% | 2.44% |
| Net Debt / EBIT (Latest) ⓘ | N/A | 7.59 |
| Net Debt / EBIT (5Y Median) ⓘ | N/A | 8.40 |
| Net Debt / EBITDA (Latest) ⓘ | 17.23 | 5.27 |
| Net Debt / Assets ⓘ | 82.18% | 37.76% |
| EBITDA / Interest ⓘ | 1.64 | 4.10 |
| Operating Margin (Latest) ⓘ | N/A | 35.29% |
| Operating Margin (5Y Median) ⓘ | 82.75% | 37.31% |
| Debt to Equity (Latest) ⓘ | 803.67% | 88.87% |
| Profit Margin (Latest) ⓘ | 90.59% | 19.61% |
| Free Cash Flow (Latest) ⓘ | $206.45M | |
Momentum (Price trend) | ||
| 3Y Return ⓘ | +19.80% | +30.75% |
| 12M Return (excl. last month) ⓘ | +3.14% | +4.36% |
| 6M Return ⓘ | -22.91% | -2.52% |
| Price vs. 200-Day MA ⓘ | -18.68% | -2.34% |
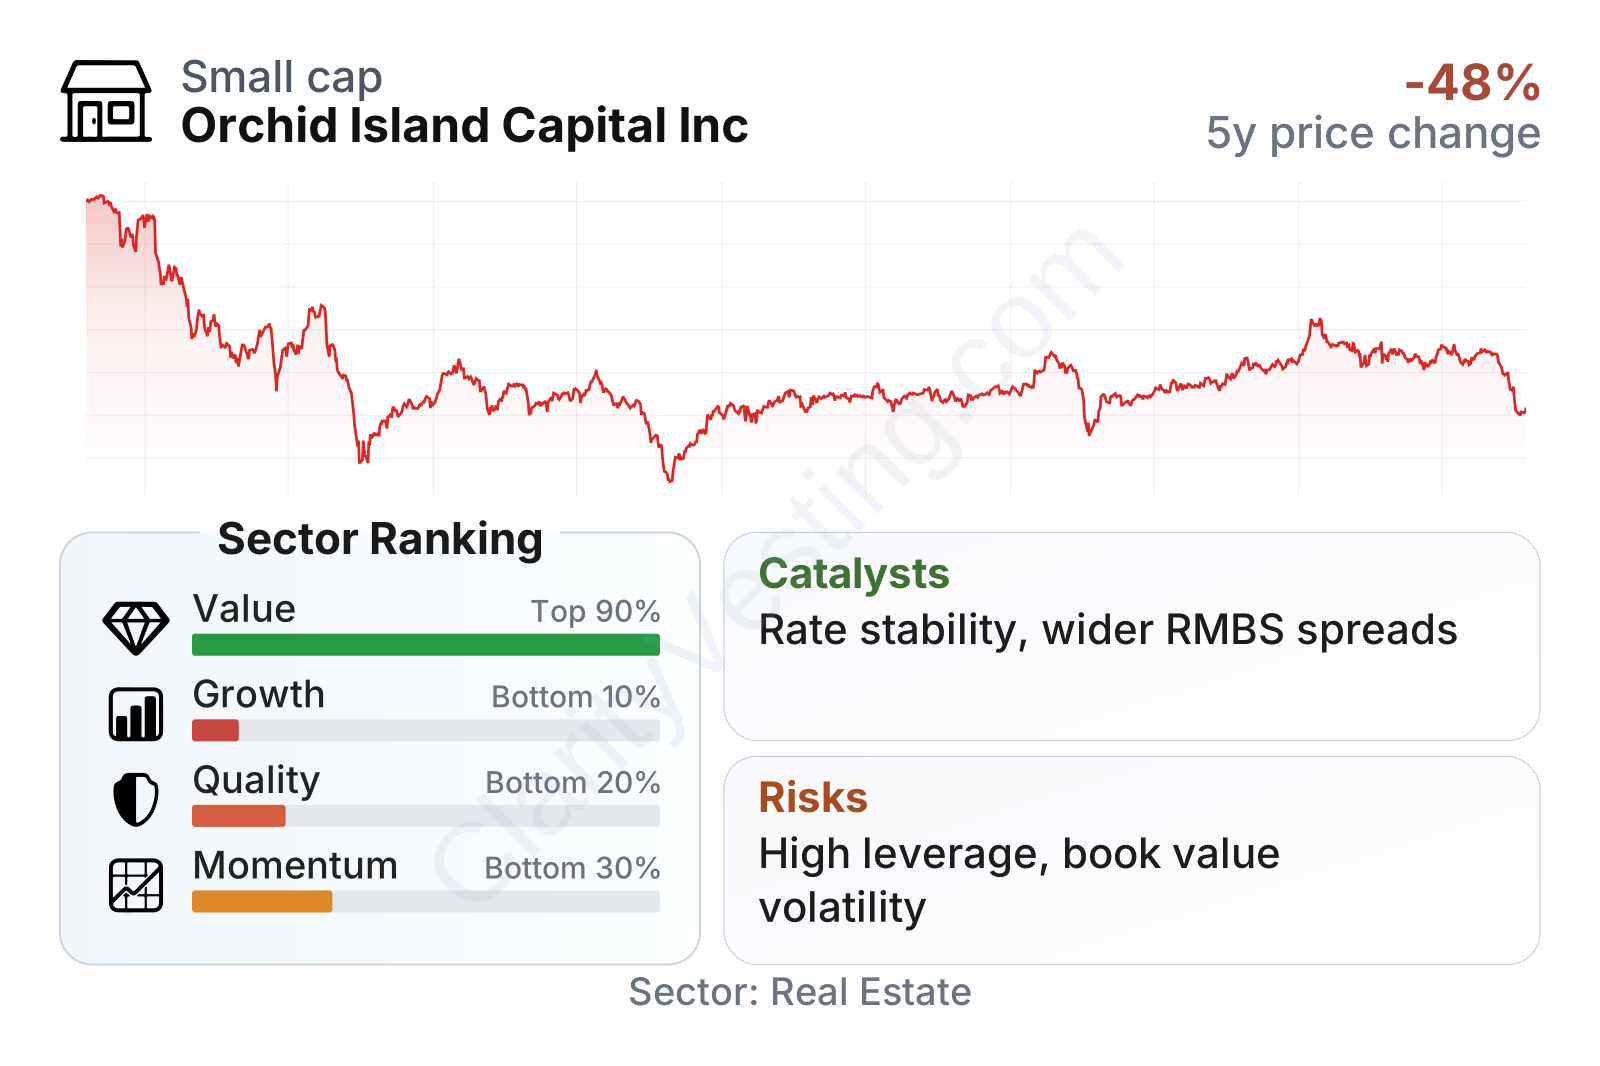
Orchid Island is a relatively small public company by market value, and its shares have shown above-average volatility, with a beta around 1.5. The stock price history reflects that instability: a steep decline through 2022, then a partial recovery, but still with wide swings. In the latest factor snapshot, the stock screens strongly on value, mainly because ratios such as price-to-earnings and price-to-book sit below sector norms and the trailing dividend yield is exceptionally high. At the same time, quality and growth rank poorly versus the broader real estate sector, which matches the company’s uneven long-term record in earnings, book value per share, and capital efficiency.
The combination is important for long-term readers: Orchid Island looks statistically cheap, but that low valuation sits beside elevated leverage, weaker profitability metrics than many peers, and a history of book value erosion. In other words, the headline valuation is easy to notice, while the underlying business stability is less reassuring.
Growth
Orchid Island operates in a sector that can expand when mortgage spreads are attractive, funding markets are functioning smoothly, and interest-rate volatility begins to cool. Mortgage REITs are not classic secular growth businesses in the way software or healthcare can be. Their opportunity set is more cyclical. When the bond market creates unusually wide spreads between mortgage yields and short-term borrowing costs, companies like Orchid Island can deploy capital into new securities at more attractive returns.
That backdrop has become more constructive than it was during the most painful part of the rate shock. The Federal Reserve’s tightening cycle and the resulting volatility damaged many mortgage REITs, but it also reset yields higher across the market. For Orchid Island, that creates a clearer path to earning better income on newly purchased assets than was available in the ultra-low-rate years.
The recent trend in revenue per share has improved sharply from negative territory in 2021-2023 to positive levels in 2024-2025. That suggests the operating environment normalized after a difficult period, and it indicates that the portfolio has been positioned to capture higher asset yields. However, the company’s longer-term growth profile still looks weak because the gains have come after a deep drawdown rather than through steady compounding.
The dividend pattern tells a similar story. Orchid Island still offers an unusually high trailing yield, but the dividend per share has been cut materially over the past five years. The latest yearly level appears to be stabilizing compared with the sharp earlier reductions, which may indicate a better balance between portfolio income and distributions, but the long-term trend is still downward rather than expansionary.
As for strategy, Orchid Island’s focus on Agency RMBS is logical for risk control because agency-backed assets carry less credit risk than non-agency mortgages. The company has also emphasized hedging and active portfolio management, which is essential in this business. A meaningful catalyst is a more stable or declining short-term rate environment, especially if mortgage spreads remain favorable. Another potential tailwind is any improvement in book value through stronger asset pricing, since book value is a central performance measure for mortgage REITs and often shapes market sentiment toward the shares.
Recent company communications in 2026 have continued to center on portfolio management, financing, and monthly dividends rather than on major strategic transformation. That is typical for this kind of company: the significant opportunities come more from market setup than from disruptive product launches or expansion into new business lines.
Risks
This article is for informational purposes only and does not constitute financial advice. Some content is AI-generated. See Disclaimer


