Stock Analysis · Oppenheimer Holdings Inc (OPY)
Overview
Oppenheimer Holdings Inc is a diversified financial services company focused on wealth management, securities brokerage, investment banking, trading, and asset management. Its operating model is built around advising wealthy individuals and families, serving corporate and institutional clients, and participating in capital markets activity such as underwriting, mergers and acquisitions advice, and securities execution.
The business is primarily driven by fees and commissions tied to client assets and transaction activity, plus gains and spreads from capital markets operations. Based on the company’s recent annual reporting structure, revenue is broadly generated from the following sources:
- Advisory and asset management fees: approximately 30% to 35% of revenue. This includes fees from managing client portfolios and advisory-based brokerage accounts.
- Commissions: approximately 20% to 25% of revenue. This comes from client trading activity in wealth management and related brokerage services.
- Investment banking: approximately 10% to 15% of revenue. This covers underwriting, private placements, and advisory work on mergers, acquisitions, and restructurings.
- Principal transactions, trading, and market-making: approximately 10% to 15% of revenue. This includes trading income and market-making activities.
- Interest revenue: approximately 20% to 25% of revenue. This reflects margin lending, securities financing, and interest earned within the firm’s balance sheet activities.
- Other revenue: a smaller remainder from service fees and miscellaneous operating income.
That mix matters because it gives Oppenheimer exposure to both recurring fee streams and more cyclical capital markets income. Wealth management tends to be steadier, while investment banking and trading can swing more sharply with market conditions.
Over the last several years, total revenue and operating income have been volatile but generally improving again after the 2022 downturn. By 2025, revenue reached a new high and net income recovered strongly, showing how sensitive results are to market activity but also how much earnings can expand when conditions are favorable.
The long-term pattern shows a business that rebounded meaningfully after a weak 2022. Revenue, operating profit, and net income all recovered into 2024 and 2025, although interest expense also climbed materially, which makes funding costs an important part of the earnings picture.
Key Figures
| Metric | Value | Sector ⓘ |
|---|---|---|
| Date | Oct 17, 2026 | |
| Context | ||
| Sector | Financial Services | |
| Industry | Capital Markets | |
| Market Cap ⓘ | $1.10B | |
| Beta ⓘ | 1.10 | |
Value (Cheapness) | ||
| P/E Ratio ⓘ | 11.43 | 12.26 |
| P/B Ratio ⓘ | 1.21 | 1.23 |
| FCF Yield ⓘ | -2.05% | 10.40% |
| Dividend Yield ⓘ | 0.71% | 3.02% |
| EBIT / EV ⓘ | 11.07% | 8.14% |
| PEG ⓘ | 12.00 | |
Growth (Business expansion) | ||
| Revenue Growth ⓘ | 24.10% | 9.35% |
| RPS Growth (5Y CAGR) ⓘ | 8.72% | 12.19% |
| EPS Growth (5Y CAGR) ⓘ | -6.28% | -9.53% |
| BVPS Growth (5Y CAGR) ⓘ | 8.88% | 4.99% |
| Margin Growth (5Y Trend) ⓘ | 0.13% | -3.86% |
| FCF Growth (5Y CAGR) ⓘ | -4.37% | 4.81% |
| DPS Growth (5Y CAGR) ⓘ | -17.50% | 8.79% |
Quality (Business durability) | ||
| ROIC (Latest) ⓘ | 10.23% | 9.49% |
| ROE (Latest) ⓘ | 10.88% | 13.90% |
| ROA (Latest) ⓘ | 2.56% | 1.55% |
| ROIC (5Y Median) ⓘ | 8.15% | 7.86% |
| ROE (5Y Median) ⓘ | 8.73% | 12.17% |
| ROA (5Y Median) ⓘ | 2.29% | 1.30% |
| Net Debt / EBIT (Latest) ⓘ | 3.69 | 0.96 |
| Net Debt / EBIT (5Y Median) ⓘ | 3.38 | 0.73 |
| Net Debt / EBITDA (Latest) ⓘ | 3.17 | 0.92 |
| Operating Margin (Latest) ⓘ | 12.87% | 22.30% |
| Operating Margin (5Y Median) ⓘ | 13.53% | 24.63% |
| Debt to Equity (Latest) ⓘ | 90.67% | 58.56% |
| Profit Margin (Latest) ⓘ | 5.99% | 26.57% |
| Free Cash Flow (Latest) ⓘ | -$22.62M | |
Momentum (Price trend) | ||
| 3Y Return ⓘ | +194.37% | +88.33% |
| 12M Return (excl. last month) ⓘ | +55.22% | +19.38% |
| 6M Return ⓘ | -10.14% | +4.75% |
| Price vs. 200-Day MA ⓘ | +1.32% | +3.50% |
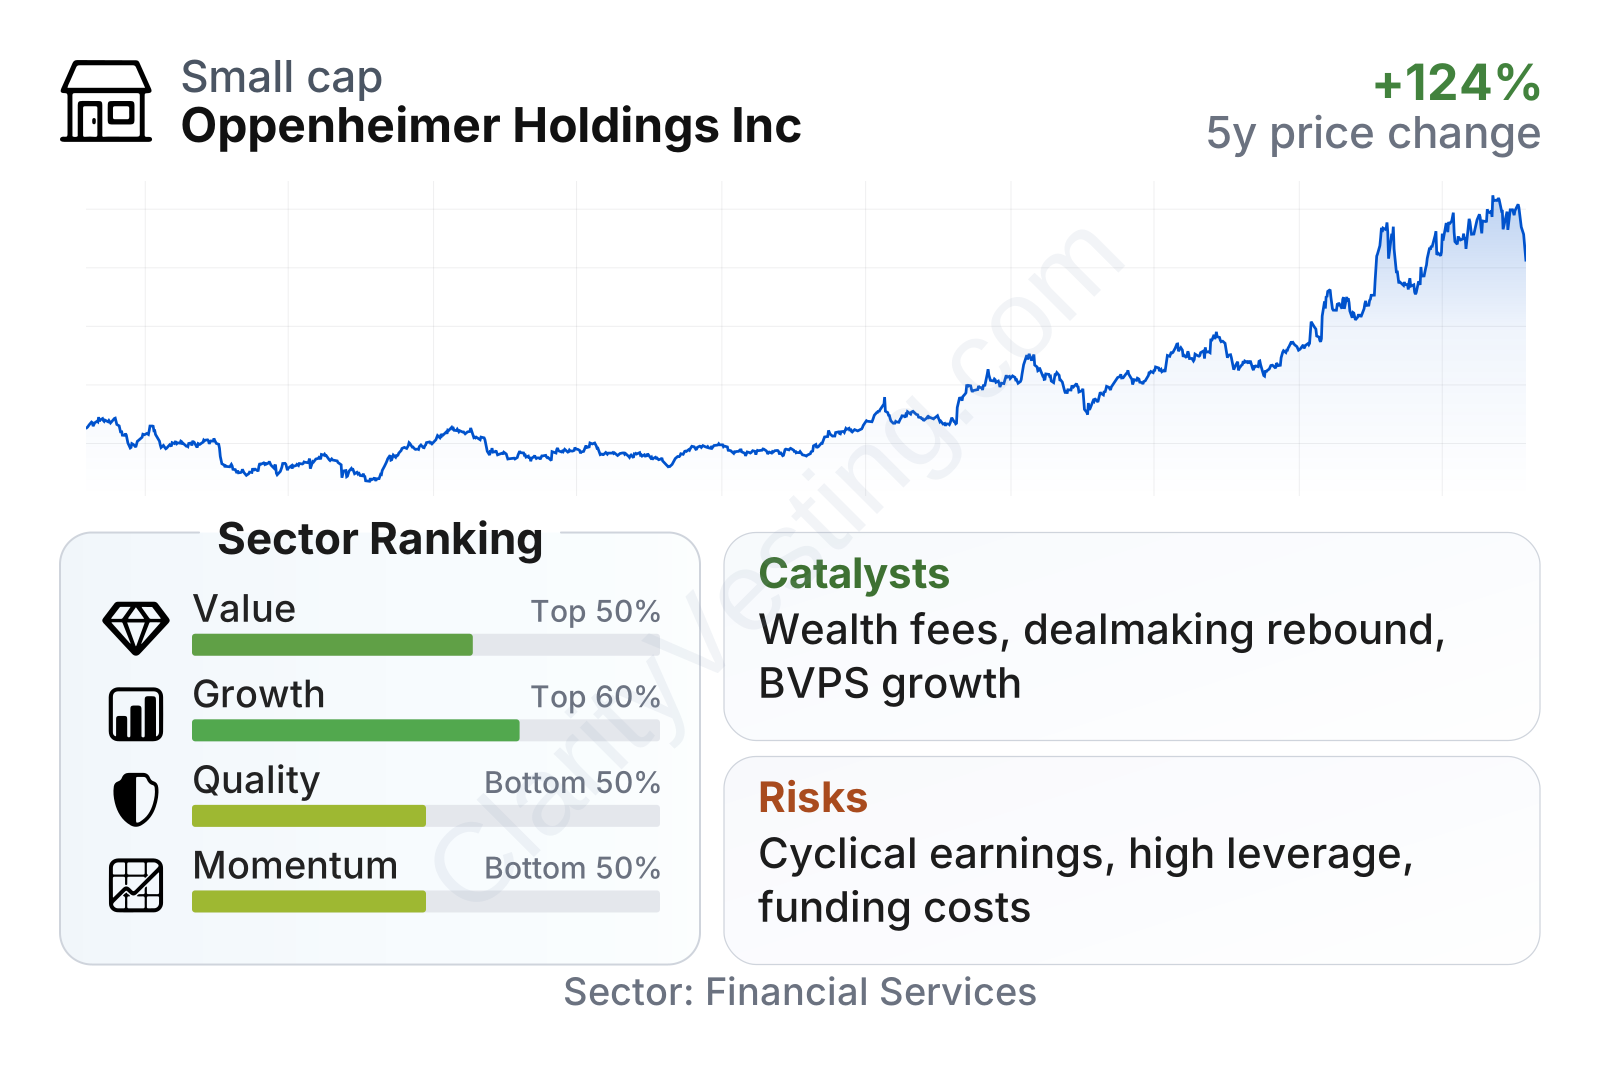
Oppenheimer is a relatively small public company within the capital markets industry, with a market value around the low-billion-dollar range. The stock has shown very strong momentum over the last one, three, and six months versus much of the sector, but the fundamental profile is more mixed. Growth metrics have improved, especially on recent revenue expansion and book value compounding, while profitability and balance-sheet quality remain less impressive than many peers. Valuation is not stretched on earnings, but it is no longer at the deep discount to book value seen in prior years.
Growth
Oppenheimer operates in a sector that should remain relevant over the long term. Wealth management benefits from the continued growth in household financial assets, an aging affluent client base that needs advice, and a structural shift toward fee-based advisory accounts. Investment banking and trading are more cyclical, but they can produce meaningful upside during stronger capital markets periods.
The company’s strategy is sensible for future growth because it leans on businesses that can reinforce each other. Wealth management provides recurring revenue and client assets, while investment banking and institutional services add upside during active market environments. This combination does not make results smooth, but it does create multiple ways to grow when markets cooperate.
One encouraging sign is the steady rise in book value per share over the last five years, which suggests the firm has been adding to intrinsic balance-sheet value over time even though earnings have fluctuated. Revenue per share growth over five years has also been positive, though not exceptional relative to the broader financial sector.
Earnings per share have been highly cyclical, dropping sharply in 2022 and then recovering strongly through 2024 and 2025. That pattern fits the nature of Oppenheimer’s business: when underwriting, advisory activity, and client engagement improve, earnings can rebound quickly.
Book value per share has moved upward at a healthy pace, noticeably faster than the sector median over five years. For a financial company, that is an important sign because book value is often a useful anchor for long-term business progress, especially when the firm retains earnings and expands client relationships.
A meaningful catalyst is any sustained reopening of equity issuance, dealmaking, and financing activity. Oppenheimer is not one of the largest Wall Street franchises, but that also means cyclical improvements can have a visible effect on its income statement. Another positive factor is the company’s strong recent share-price performance, which often reflects improving market expectations for earnings and business conditions.
Recent company reporting has also shown stronger annual revenue and profit recovery than in the post-2022 slump period. That does not guarantee a straight line upward, but it indicates the franchise remained intact and capable of benefiting from a better operating backdrop.
Risks
This article is for informational purposes only and does not constitute financial advice. Some content is AI-generated. See Disclaimer


