Stock Analysis · Option Care Health Inc (OPCH)
Overview
Option Care Health is a U.S. healthcare services company focused on infusion and related care delivered outside the traditional hospital setting. In plain terms, it helps patients receive complex medications, nutrition support, and certain specialty treatments at home, at dedicated infusion suites, or through coordinated ambulatory services. This matters because many therapies that once required hospital visits can now be delivered in lower-cost settings, which is attractive to insurers, health systems, and patients.
The company operates primarily as a single business, but its revenue comes from several identifiable treatment categories and service activities described in company filings. Based on recent annual disclosures, the biggest revenue contributors are approximately:
- Anti-infective therapies: about 31% of revenue. These include intravenous antibiotics and related treatments often used after hospital discharge.
- Acute therapies: about 23%. This category includes higher-acuity infusion treatments such as inotropes and other complex drug therapies.
- Immunoglobulin therapies: about 20%. These are immune-related treatments used for chronic conditions and are a strategically important specialty area.
- Parenteral nutrition and enteral nutrition: about 12%. These services support patients who cannot receive adequate nutrition through normal eating.
- Other therapies and services: about 14%. This includes additional specialty infusion offerings and related patient support services.
Its customer base is diversified across commercial insurers, government programs, hospitals, physicians, and patients. The business model is fairly straightforward: Option Care Health coordinates pharmacy services, nursing, reimbursement support, and clinical monitoring around therapies that are often recurring and medically necessary. That creates a healthcare delivery platform with both service revenue and medication-related revenue, but also with heavy dependence on drug costs and reimbursement mechanics.
Over the last several years, the company has expanded revenue meaningfully, moving from roughly $3.4 billion in 2021 to about $5.6 billion in 2025. At the same time, gross profit has increased, showing that growth has not come only from volume, but also from a broader specialty mix and operating scale. Net income has been more uneven than revenue, which is common in healthcare services businesses where reimbursement timing, payer mix, and treatment mix can affect margins.
The overall picture is of a company with rising sales, fairly stable gross profit dollars, and operating expenses that have grown more slowly than revenue over the full period, although not in a perfectly straight line. That points to a business that has gained scale, even if margin expansion has recently cooled.
Key Figures
| Metric | Value | Sector ⓘ |
|---|---|---|
| Date | Oct 24, 2026 | |
| Context | ||
| Sector | Healthcare | |
| Industry | Medical Care Facilities | |
| Market Cap ⓘ | $4.69B | |
| Beta ⓘ | 0.58 | |
Value (Cheapness) | ||
| P/E Ratio ⓘ | 23.70 | 25.42 |
| P/B Ratio ⓘ | 3.87 | 3.08 |
| FCF Yield ⓘ | 7.40% | 3.12% |
| Dividend Yield ⓘ | N/A | 1.85% |
| EBIT / EV ⓘ | 7.52% | 0.56% |
| PEG ⓘ | 1.12 | |
Growth (Business expansion) | ||
| Revenue Growth ⓘ | 1.90% | 7.50% |
| RPS Growth (5Y CAGR) ⓘ | 16.19% | 8.60% |
| EPS Growth (5Y CAGR) ⓘ | -0.65% | -17.73% |
| BVPS Growth (5Y CAGR) ⓘ | 5.76% | 3.72% |
| Margin Growth (5Y Trend) ⓘ | 0.79% | -0.57% |
| FCF Growth (5Y CAGR) ⓘ | 4.38% | 0.96% |
| DPS Growth (5Y CAGR) ⓘ | -54.19% | 6.69% |
Quality (Business durability) | ||
| ROIC (Latest) ⓘ | 10.17% | 3.17% |
| ROA (Latest) ⓘ | 6.11% | 2.98% |
| ROIC (5Y Median) ⓘ | 10.06% | 4.56% |
| ROA (5Y Median) ⓘ | 6.04% | 1.87% |
| Net Debt / EBIT (Latest) ⓘ | 3.12 | 1.34 |
| Net Debt / EBIT (5Y Median) ⓘ | 3.01 | 1.86 |
| Net Debt / EBITDA (Latest) ⓘ | 2.59 | 1.00 |
| Net Debt / Assets ⓘ | 31.80% | 5.06% |
| EBITDA / Interest ⓘ | 7.11 | 9.55 |
| Operating Margin (Latest) ⓘ | 6.04% | 9.25% |
| Operating Margin (5Y Median) ⓘ | 6.58% | 7.33% |
| Debt to Equity (Latest) ⓘ | 100.65% | 26.68% |
| Profit Margin (Latest) ⓘ | 3.68% | 3.34% |
| Free Cash Flow (Latest) ⓘ | $346.81M | |
Momentum (Price trend) | ||
| 3Y Return ⓘ | -2.64% | +51.61% |
| 12M Return (excl. last month) ⓘ | -16.64% | +19.90% |
| 6M Return ⓘ | +10.25% | +10.10% |
| Price vs. 200-Day MA ⓘ | +18.65% | +6.44% |
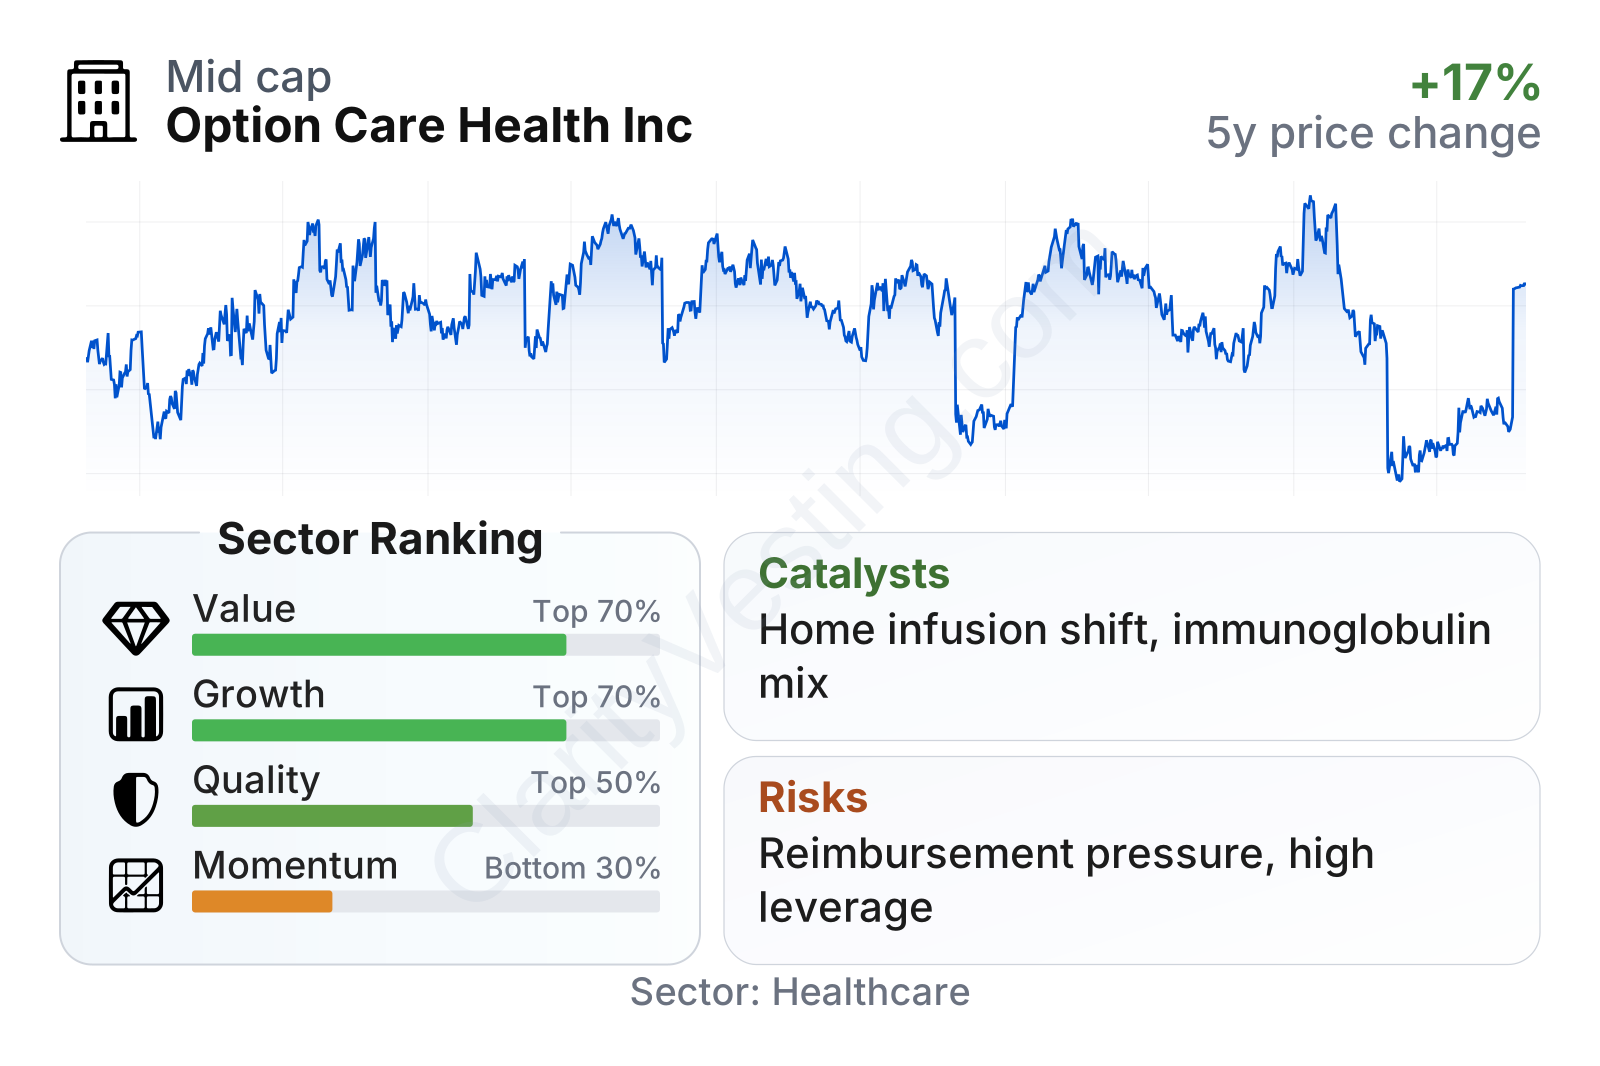
Option Care Health is a mid-sized healthcare company with a relatively low share-price volatility profile, as suggested by a beta well below 1. On valuation and cash generation, the profile looks stronger than much of the healthcare sector: its earnings multiple is below the sector median, while free cash flow yield and return on invested capital are notably stronger. Growth is more mixed. Long-term revenue-per-share growth has been solid, but recent year-over-year sales growth has slowed sharply. Share-price momentum is clearly weak, with the stock down over multiple recent periods and trading below its long-term average trend line.
Growth
Option Care Health operates in a part of healthcare that has favorable long-term demand drivers. The U.S. population is aging, chronic disease prevalence remains high, and payers continue to look for less expensive settings of care than hospitals. Home and alternate-site infusion fits directly into that trend. For many therapies, it can improve convenience for patients while lowering costs for insurers and health systems. That makes the sector structurally attractive even when short-term volumes fluctuate.
The company’s strategy also makes sense for future growth. It has built a nationwide network of infusion pharmacies and ambulatory infusion suites, which helps it serve patients across multiple settings. That matters because providers and payers increasingly want partners that can coordinate discharge from hospitals, manage specialty therapies, and keep patients compliant over longer treatment periods. Scale in this field can support contracting leverage, clinical coordination, and referral relationships.
Recent growth, however, needs to be read carefully. Revenue growth was consistently strong through most of 2022 to 2025, often running in the high single digits to high teens, but it slowed dramatically in the first half of 2026 to around 1% to 2%. That does not erase the longer trend, but it does suggest that growth has become harder to sustain at the pace seen in prior years. For a long-term view, the key question is whether this is a pause tied to treatment mix and comparisons, or a sign of a more mature phase.
Cash generation remains an important positive. Free cash flow has been positive and, despite some volatility, has generally improved versus earlier years. That is useful in this industry because it gives the company room to invest in sites, technology, and acquisitions without relying entirely on new financing. It also helps offset concerns that can arise when earnings growth slows.
A visible catalyst is the continued shift of infusion treatments away from hospitals and into home or ambulatory settings. Another is the ongoing expansion of specialty therapies, including immunoglobulin and other chronic treatments that can create repeat utilization. The company has also discussed acquisitions as part of its operating approach in prior filings, and the industry remains fragmented enough for selective deals to support network density and referral reach. The strongest near-term opportunity is likely not a single breakthrough event, but steady capture of a larger share of infusion care moving into lower-cost sites.
Risks
This article is for informational purposes only and does not constitute financial advice. Some content is AI-generated. See Disclaimer


