Stock Analysis · Onex Corp (ONEXF)
Overview
Onex Corporation is a Canadian investment company focused on private equity, private credit, and the management of third-party capital. In simple terms, it raises money from institutional clients such as pension funds and also invests its own balance sheet alongside them. Its business has two main parts: earning recurring fees for managing assets, and generating investment gains from the companies, funds, and credit strategies it owns.
Today, the company operates primarily through two investing platforms: Onex Partners on the private equity side and Gluskin Sheff / related wealth and asset management activities, together with private credit strategies managed through its asset management operations. Over time, Onex has been shifting toward a more asset-light model in which fee-related earnings matter more, because management fees are usually steadier than investment gains that move with markets and exits.
The revenue mix can swing sharply from year to year because realized gains, unrealized valuation changes, and carried interest can be large. Based on the company’s recent reporting structure, the most important economic sources are best understood as follows:
- Investment gains and performance-related income: typically the largest and most volatile contributor in stronger years. This includes realized gains on sales, fair value changes, and carried interest tied to fund performance.
- Management and advisory fees: a meaningful recurring stream generated from managing third-party capital across private equity, credit, and wealth-related activities.
- Interest and other investment income: income from credit strategies, cash balances, and other invested assets.
Because Onex is an alternative asset manager with a sizable investing balance sheet, standard revenue percentages are less stable than at a typical operating company. Recent annual results suggest that recurring fee income is important, but total reported revenue still depends heavily on investment marks and monetizations, which can materially alter the mix from one period to another.
The business flow highlights that profitability can remain strong even when reported revenue is uneven, a common feature for firms whose earnings include fair value changes and exits rather than only cash fees.
Key Figures
| Metric | Value | Sector ⓘ |
|---|---|---|
| Date | Oct 17, 2026 | |
| Context | ||
| Sector | Financial Services | |
| Industry | Asset Management | |
| Market Cap ⓘ | $5.49B | |
| Beta ⓘ | 1.02 | |
Value (Cheapness) | ||
| P/E Ratio ⓘ | 11.13 | 12.26 |
| P/B Ratio ⓘ | 0.40 | 1.23 |
| FCF Yield ⓘ | -2.81% | 10.40% |
| Dividend Yield ⓘ | 0.41% | 3.02% |
| EBIT / EV ⓘ | 7.72% | 8.14% |
| PEG ⓘ | N/A | |
Growth (Business expansion) | ||
| Revenue Growth ⓘ | -38.40% | 9.35% |
| RPS Growth (5Y CAGR) ⓘ | -29.15% | 12.19% |
| EPS Growth (5Y CAGR) ⓘ | 5.03% | -9.53% |
| BVPS Growth (5Y CAGR) ⓘ | 16.28% | 4.99% |
| Margin Growth (5Y Trend) ⓘ | 146.75% | -3.86% |
| FCF Growth (5Y CAGR) ⓘ | 18.69% | 4.81% |
| DPS Growth (5Y CAGR) ⓘ | 5.68% | 8.79% |
Quality (Business durability) | ||
| ROIC (Latest) ⓘ | 4.05% | 9.49% |
| ROE (Latest) ⓘ | 5.24% | 13.90% |
| ROA (Latest) ⓘ | 4.00% | 1.55% |
| ROIC (5Y Median) ⓘ | 4.39% | 7.86% |
| ROE (5Y Median) ⓘ | 6.29% | 12.17% |
| ROA (5Y Median) ⓘ | 4.22% | 1.30% |
| Net Debt / EBIT (Latest) ⓘ | -0.21 | 0.96 |
| Net Debt / EBIT (5Y Median) ⓘ | 6.87 | 0.73 |
| Net Debt / EBITDA (Latest) ⓘ | -0.20 | 0.92 |
| Operating Margin (Latest) ⓘ | 173.51% | 22.30% |
| Operating Margin (5Y Median) ⓘ | 54.00% | 24.63% |
| Debt to Equity (Latest) ⓘ | 0.29% | 58.56% |
| Profit Margin (Latest) ⓘ | 66.12% | 26.57% |
| Free Cash Flow (Latest) ⓘ | -$154.18M | |
Momentum (Price trend) | ||
| 3Y Return ⓘ | +24.87% | +88.33% |
| 12M Return (excl. last month) ⓘ | -10.79% | +19.38% |
| 6M Return ⓘ | -11.57% | +4.75% |
| Price vs. 200-Day MA ⓘ | -8.11% | +3.50% |
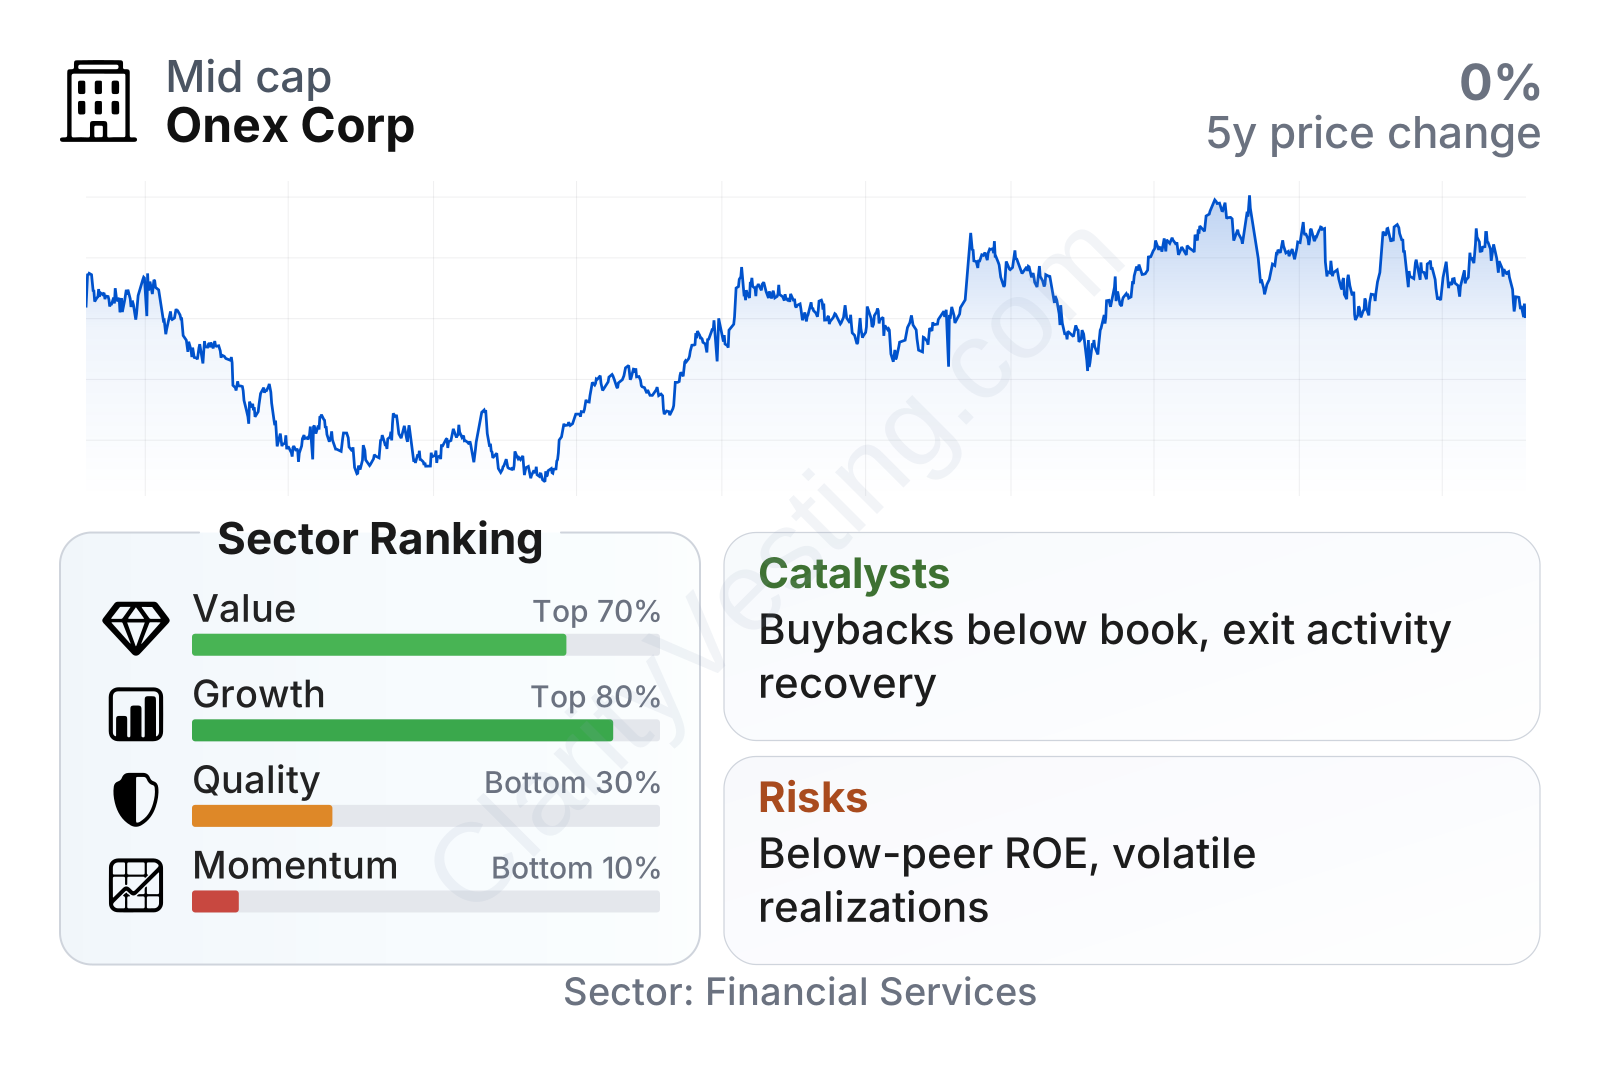
Onex is a mid-sized public alternative asset manager with a market value in the mid-single-digit billions of dollars and a beta close to 1, meaning its share price has broadly moved with the market rather than behaving like an extreme outlier. The stock has climbed meaningfully from 2022 lows, but recent momentum has been softer than the broader Financial Services group. In the factor table, valuation looks inexpensive relative to the sector, especially on price-to-book, while growth and quality give a more mixed picture. Profitability margins appear strong, but returns on equity remain below sector norms, which is an important distinction for a capital allocator.
Growth
Onex operates in alternative asset management, a sector that still has long-term structural tailwinds. Large institutions continue to increase allocations to private markets in search of diversification, private credit has gained share as traditional banks have pulled back from some lending segments, and wealth platforms are increasingly looking for access to private assets. Those trends support firms that can raise long-duration capital and build repeatable fee streams.
For Onex specifically, the strategic logic is clear: expand fee-generating assets under management while using its own capital selectively to seed strategies and align with clients. That approach can reduce reliance on lumpy exits over time. It also fits the company’s effort to simplify the business and emphasize recurring earnings rather than purely balance-sheet-driven results.
Earnings per share have been volatile, which is normal for an investment company but still important for long-term readers to recognize. Results can jump when valuations rise or assets are sold at gains, then cool when realizations slow. Even so, the multi-year earnings trend has held up better than many sector peers, and margin trends have improved substantially over five years.
Book value per share has been one of the stronger signals in Onex’s profile. Over the last five years, book value per share compounded at a rate well above the sector median, suggesting the company has continued to build underlying net asset value despite uneven reported revenue. For an investment company trading below book value, this measure often matters more than headline sales growth.
A practical catalyst is the possibility of stronger fundraising and deployment in private credit and private equity after a slower industry period. Another is the eventual conversion of unrealized value into realized gains as portfolio companies are sold or refinanced. If capital markets remain open and deal activity improves, Onex could benefit from both performance fees and a clearer demonstration of portfolio value.
Recent corporate communication has also continued to emphasize capital returns and disciplined balance-sheet management. With very low current leverage and a share price still below book value, repurchases can materially increase per-share value when executed consistently.
Risks
This article is for informational purposes only and does not constitute financial advice. Some content is AI-generated. See Disclaimer


