Stock Analysis · Omada Health Inc (OMDA)
Overview
Omada Health is a digital healthcare company focused on chronic condition management. Its platform combines connected devices, software, health coaching, and clinical support to help people manage issues such as prediabetes, diabetes, hypertension, and musculoskeletal conditions. The company mainly sells its services to employers, health plans, pharmacy benefit managers, and other organizations that pay for healthcare, rather than directly to consumers.
The business model is built around recurring service revenue from contracted programs. Based on the company’s public filings, Omada’s revenue is largely generated from fees tied to member enrollment and participation in its care programs, with a smaller contribution from device-related and other support services bundled into those programs.
Main revenue sources are best understood as:
- Chronic care program services: the large majority of revenue, estimated at well above 80%. This includes virtual prevention and care programs for cardiometabolic conditions, behavioral support, and musculoskeletal care delivered through Omada’s platform.
- Connected devices and program-related supplies: a small minority of revenue. This covers items such as smart scales, blood pressure monitors, glucose-related tools, and other equipment used to support member engagement and monitoring.
- Other implementation and support services: a very small share. This may include onboarding, integration, and similar support tied to enterprise customers.
Financially, the company has been moving from a high-loss growth phase toward much narrower losses and positive free cash flow. Revenue rose from about $90 million in 2022 to about $260 million in 2025, while net losses shrank materially over the same period. That combination is important because it suggests the platform is scaling without the cost base rising at the same pace.
The longer-term pattern is encouraging: revenue has expanded quickly, gross profit has grown even faster, and operating losses have narrowed sharply. Selling, general, and administrative costs are still significant, but they have become a smaller burden relative to sales as the business matures.
Key Figures
| Metric | Value | Sector ⓘ |
|---|---|---|
| Date | Oct 17, 2026 | |
| Context | ||
| Sector | Healthcare | |
| Industry | Health Information Services | |
| Market Cap ⓘ | $1.12B | |
| Beta ⓘ | N/A | |
Value (Cheapness) | ||
| P/E Ratio ⓘ | 75.92 | 24.79 |
| P/B Ratio ⓘ | 4.72 | 3.08 |
| FCF Yield ⓘ | 2.04% | 3.15% |
| Dividend Yield ⓘ | N/A | 1.94% |
| EBIT / EV ⓘ | 0.41% | 0.57% |
| PEG ⓘ | N/A | |
Growth (Business expansion) | ||
| Revenue Growth ⓘ | 43.10% | 7.45% |
| RPS Growth (5Y CAGR) ⓘ | 40.66% | 8.61% |
| EPS Growth (5Y CAGR) ⓘ | N/A | -17.81% |
| BVPS Growth (5Y CAGR) ⓘ | 12.08% | 3.72% |
| Margin Growth (5Y Trend) ⓘ | N/A | -0.62% |
| FCF Growth (5Y CAGR) ⓘ | N/A | 1.04% |
| DPS Growth (5Y CAGR) ⓘ | N/A | 6.77% |
Quality (Business durability) | ||
| ROIC (Latest) ⓘ | 1.45% | 3.24% |
| ROA (Latest) ⓘ | 1.40% | 3.01% |
| ROIC (5Y Median) ⓘ | N/A | 4.60% |
| ROA (5Y Median) ⓘ | -28.92% | 1.89% |
| Net Debt / EBIT (Latest) ⓘ | -50.97 | 1.34 |
| Net Debt / EBIT (5Y Median) ⓘ | N/A | 1.84 |
| Net Debt / EBITDA (Latest) ⓘ | -21.64 | 1.00 |
| Net Debt / Assets ⓘ | -67.55% | 5.45% |
| EBITDA / Interest ⓘ | 25.74 | 9.64 |
| Operating Margin (Latest) ⓘ | 1.40% | 9.27% |
| Operating Margin (5Y Median) ⓘ | -38.13% | 7.38% |
| Debt to Equity (Latest) ⓘ | N/A | 28.58% |
| Profit Margin (Latest) ⓘ | 1.39% | 3.59% |
| Free Cash Flow (Latest) ⓘ | $22.75M | |
Momentum (Price trend) | ||
| 3Y Return ⓘ | N/A | +42.80% |
| 12M Return (excl. last month) ⓘ | -11.16% | +18.50% |
| 6M Return ⓘ | +42.30% | +7.57% |
| Price vs. 200-Day MA ⓘ | +6.63% | +5.12% |
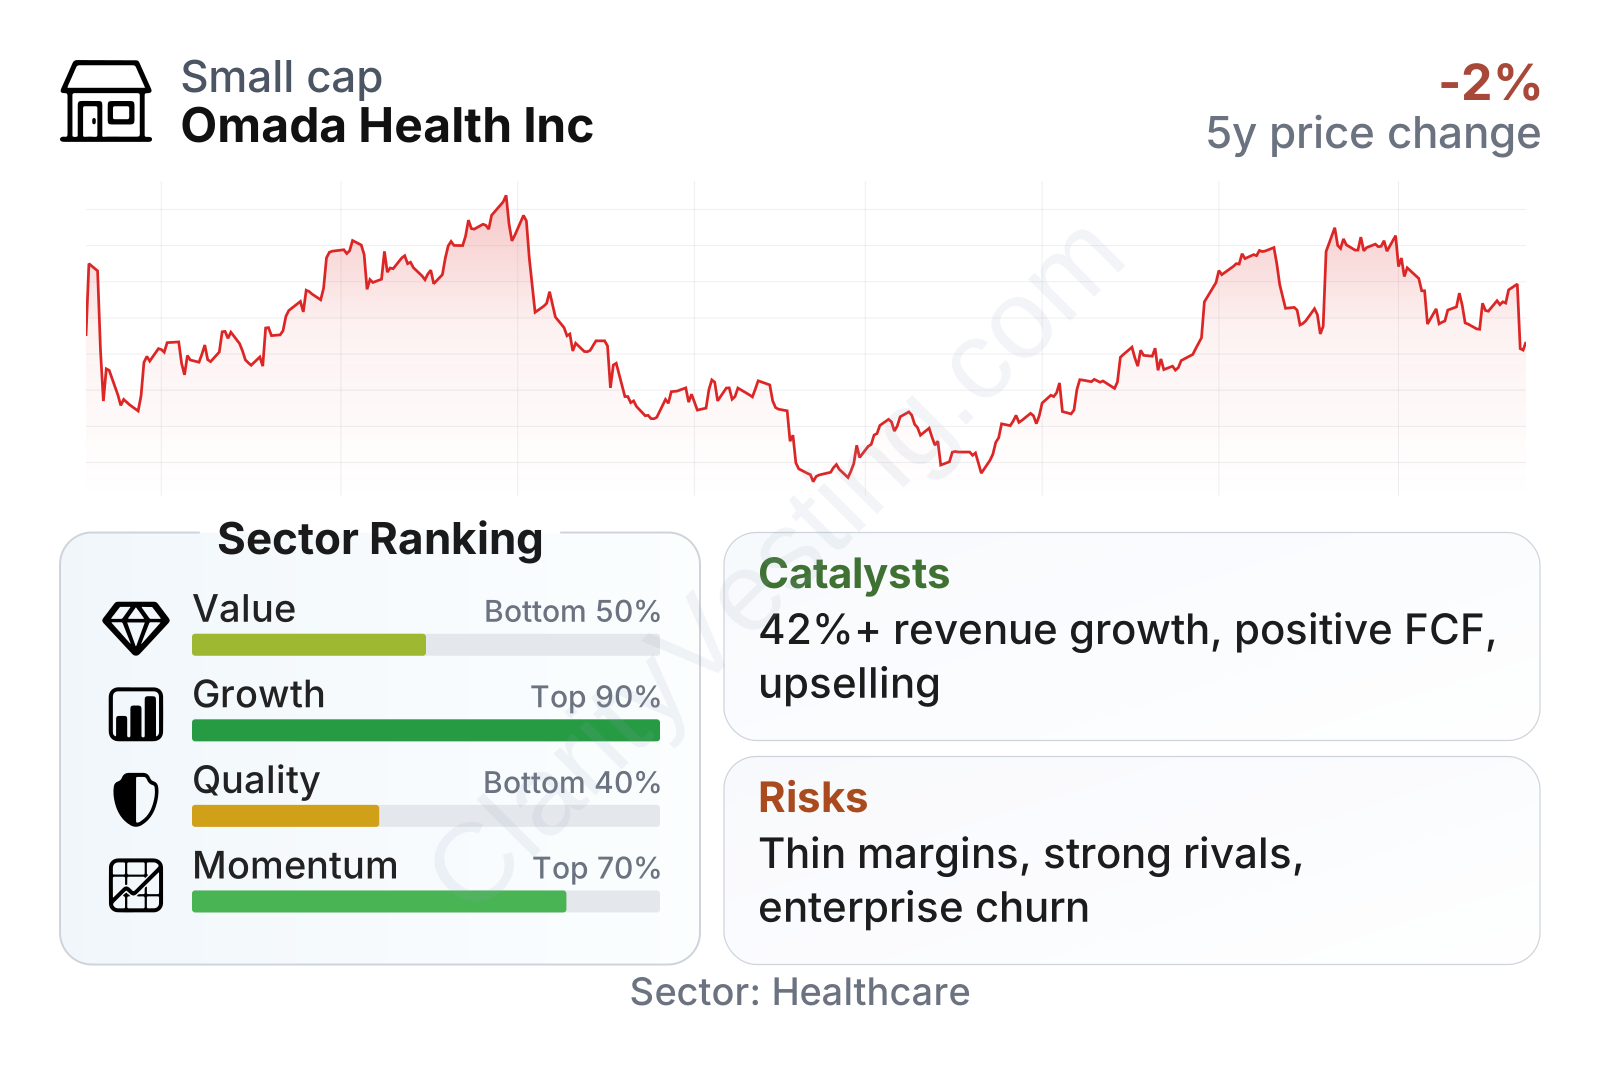
Omada is still a relatively small public healthcare technology company, with a market value in the low single-digit billions of dollars. The most striking feature in the metrics is the contrast between very strong growth and only moderate current profitability. Revenue growth is far above the sector median, momentum has improved, and free cash flow has turned positive. At the same time, returns on capital and margins remain below typical healthcare peers, which shows the company is still early in its profitability journey rather than already operating as a fully mature platform.
Growth
Omada operates in a part of healthcare with clear structural tailwinds. Chronic diseases account for a large share of medical spending in the United States, and employers and insurers continue to look for ways to improve outcomes while lowering long-term costs. That gives digital care platforms a large addressable market, especially when they can show measurable engagement, clinical improvement, and economic value for customers.
The company’s strategy is coherent for this environment. Instead of offering a narrow app, Omada combines coaching, clinical pathways, connected monitoring, and enterprise integration. That makes it more useful for customers that want a broader solution rather than a single-point tool. It also supports cross-selling: a client that starts with one condition program can potentially add others over time, raising revenue per customer and making the platform stickier.
Recent growth remains strong. Year-over-year revenue growth has been running at roughly 42% to 43%, which is far above the median growth rate across the broader healthcare sector. For a long-term business case, that matters because it suggests Omada is not just participating in a growing market, but gaining traction faster than many peers.
Another important signal is cash generation. Free cash flow turned positive and improved into 2026, which reduces one of the biggest concerns often attached to digital health companies. A business can grow quickly for years, but if it constantly consumes cash, that growth is less durable. Omada’s recent trend points to improving operating discipline alongside expansion.
A meaningful catalyst is the broader shift by payers and employers toward outcomes-based, technology-enabled care models. If Omada continues to prove that its programs reduce downstream costs from diabetes, hypertension, or musculoskeletal issues, it can strengthen its position in contract renewals and new customer wins. Its ability to serve multiple chronic conditions on one platform may also become more valuable as healthcare buyers try to reduce vendor complexity.
Recent company disclosures also point to continued progress in scaling the business after its public listing period, with improving margins, stronger cash flow, and ongoing demand for its programs. In practical terms, the opportunity is not only more members, but also deeper penetration within existing clients and broader adoption across benefit ecosystems.
Risks
This article is for informational purposes only and does not constitute financial advice. Some content is AI-generated. See Disclaimer


