Stock Analysis · Olin Corporation (OLN)
Overview
Olin Corporation is a U.S. chemicals and ammunition manufacturer with operations centered on chlor-alkali products, vinyls, epoxies, and Winchester ammunition. In simple terms, it turns salt, electricity, and other industrial inputs into basic chemicals used across construction, water treatment, packaging, automotive, electronics, and many other end markets. Through Winchester, it also sells ammunition to commercial customers, law enforcement, and the U.S. military.
Its business is organized into three main revenue sources. Based on the latest annual mix reported in company filings, the approximate breakdown is:
- Chlor Alkali Products and Vinyls: about 45% to 50% of revenue. This includes chlorine, caustic soda, bleach, hydrochloric acid, potassium hydroxide, chlorinated organics, vinyl chloride monomer, and related products used in industrial and infrastructure applications.
- Epoxy: about 30% to 35% of revenue. This segment makes epoxy resins and related intermediates used in coatings, adhesives, composites, electronics, and construction materials.
- Winchester: about 15% to 20% of revenue. This includes sporting ammunition, small-caliber military ammunition, industrial cartridges, and related products.
That mix matters because Olin is not a pure specialty-chemicals company with stable pricing power. A large part of the business is tied to commodity chemical cycles, where selling prices and plant utilization can swing sharply with industrial demand, energy costs, and global supply. Winchester adds diversification and a more recognizable consumer-facing brand, but chemicals still drive most of the company’s economics.
Over the last several years, the business has moved from exceptionally strong profits during the post-pandemic upcycle to much weaker earnings as chemical conditions softened. Revenue remains large in absolute terms, but margins have compressed materially, showing how sensitive Olin can be to the cycle.
The long-term picture shows a business that generated very strong profits in 2021 and 2022, then saw a steep drop in operating and net income as pricing and demand normalized. Revenue has held up better than profit, which suggests the main pressure has come from weaker margins rather than a collapse in the company’s industrial footprint.
Key Figures
| Metric | Value | Sector ⓘ |
|---|---|---|
| Date | Oct 17, 2026 | |
| Context | ||
| Sector | Basic Materials | |
| Industry | Chemicals | |
| Market Cap ⓘ | $1.69B | |
| Beta ⓘ | 1.23 | |
Value (Cheapness) | ||
| P/E Ratio ⓘ | N/A | 16.90 |
| P/B Ratio ⓘ | 1.00 | 1.65 |
| FCF Yield ⓘ | 5.94% | 5.76% |
| Dividend Yield ⓘ | 5.44% | 2.13% |
| EBIT / EV ⓘ | -0.21% | 6.30% |
| PEG ⓘ | 7.05 | |
Growth (Business expansion) | ||
| Revenue Growth ⓘ | -0.90% | 11.10% |
| RPS Growth (5Y CAGR) ⓘ | 2.00% | 4.49% |
| EPS Growth (5Y CAGR) ⓘ | N/A | -13.47% |
| BVPS Growth (5Y CAGR) ⓘ | -0.78% | 5.51% |
| Margin Growth (5Y Trend) ⓘ | -19.94% | -1.54% |
| FCF Growth (5Y CAGR) ⓘ | -36.66% | 0.37% |
| DPS Growth (5Y CAGR) ⓘ | 0.48% | 6.08% |
Quality (Business durability) | ||
| ROIC (Latest) ⓘ | -4.16% | 9.26% |
| ROA (Latest) ⓘ | -1.85% | 4.91% |
| ROIC (5Y Median) ⓘ | 5.40% | 7.70% |
| ROA (5Y Median) ⓘ | 5.84% | 3.86% |
| Net Debt / EBIT (Latest) ⓘ | N/A | 1.40 |
| Net Debt / EBIT (5Y Median) ⓘ | 8.36 | 1.70 |
| Net Debt / EBITDA (Latest) ⓘ | 6.62 | 0.95 |
| Net Debt / Assets ⓘ | 43.41% | 13.69% |
| EBITDA / Interest ⓘ | 2.70 | 12.34 |
| Operating Margin (Latest) ⓘ | -0.16% | 13.20% |
| Operating Margin (5Y Median) ⓘ | 5.44% | 11.80% |
| Debt to Equity (Latest) ⓘ | 199.11% | 40.56% |
| Profit Margin (Latest) ⓘ | -2.94% | 6.43% |
| Free Cash Flow (Latest) ⓘ | $100.60M | |
Momentum (Price trend) | ||
| 3Y Return ⓘ | -66.05% | +68.89% |
| 12M Return (excl. last month) ⓘ | -33.66% | +30.21% |
| 6M Return ⓘ | -45.65% | -4.16% |
| Price vs. 200-Day MA ⓘ | -32.78% | -1.27% |
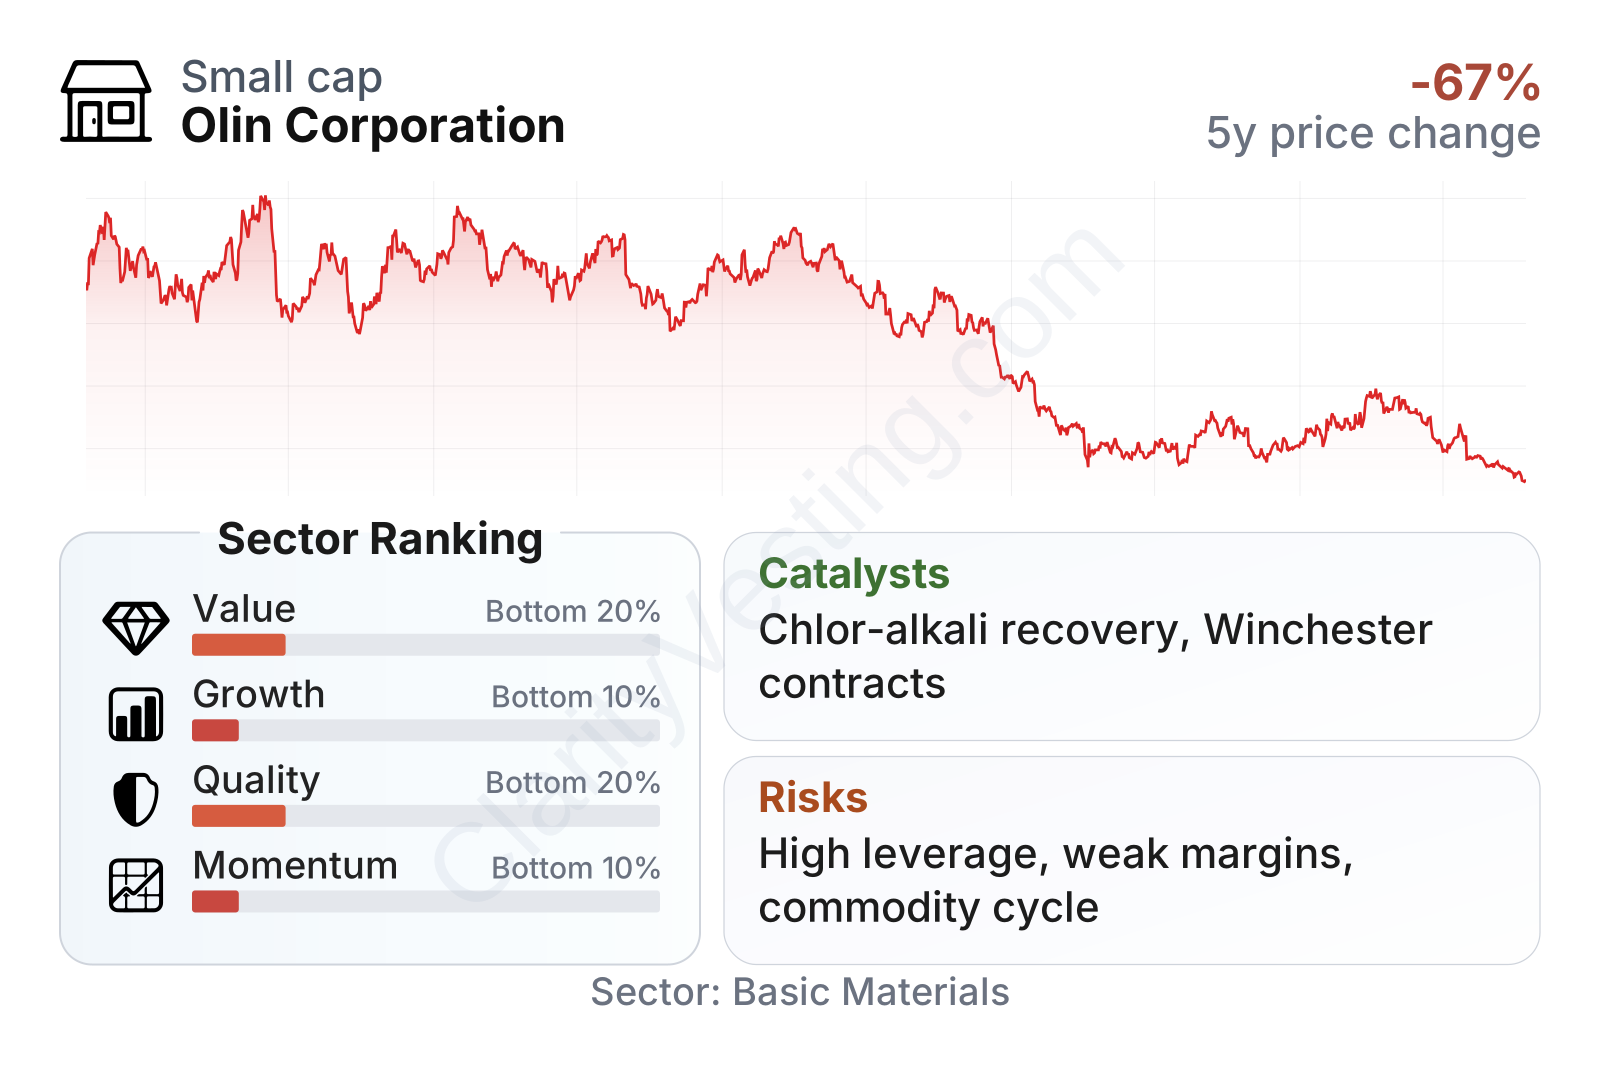
Olin currently screens as weak on growth, quality, and momentum relative to most chemicals peers, while the valuation picture is mixed rather than clearly cheap. The dividend yield stands well above the sector median and the price-to-book ratio is low, but those positives are offset by negative recent profitability, weak returns on capital, and a balance sheet that looks stretched for a cyclical business. The company is also in the lower end of the sector by market value, which can make earnings swings more visible in the share price.
The stock chart also reflects how much sentiment has changed. After trading above $50 during stronger industry conditions, the shares have spent much of the more recent period significantly lower, with large swings in both directions. That volatility fits the profile of a cyclical chemicals company rather than a steady compounder.
Growth
Olin operates in sectors that should remain relevant for a long time. Chlor-alkali products are basic industrial building blocks, epoxy materials are used in durable growth markets such as electronics, coatings, and energy-related applications, and ammunition demand tends to have its own drivers. So the company is not in a declining industry in the structural sense. The issue is that these are not consistently high-growth markets either. They are mature markets with pockets of expansion, and results depend heavily on supply-demand balance.
Management’s strategy has been centered on running existing assets more efficiently, prioritizing cash generation, reducing lower-return exposure when conditions are weak, and leaning on integrated production advantages. That approach makes industrial sense for a commodity-exposed company. Olin does not need to reinvent demand for chlorine or caustic soda; it needs to produce at the right cost, avoid flooding the market, and protect margins through the cycle. In Winchester, the strategy also benefits from long-standing customer relationships and government contracts.
Recent sales trends show how difficult the last stretch has been. After very strong growth in 2021 and early 2022, revenue turned negative for much of 2022 through 2024, then briefly stabilized before slipping again in 2026. That pattern points to a business still searching for a firm recovery rather than one already back in a clear expansion phase.
Cash generation tells a similar story. Free cash flow was exceptionally strong a few years ago, then fell sharply as the cycle weakened. There has been some rebound from the trough, but the level remains far below the earlier peak. For long-term analysis, that means Olin’s cash profile can improve meaningfully when conditions cooperate, yet it also shows that peak-cycle results should not be treated as normal.
The clearest catalysts are tied to cyclical recovery rather than a major new product launch. If chlorine, caustic soda, and epoxy pricing improve, Olin’s earnings can move materially because fixed industrial assets create operating leverage. Winchester can also help if military volumes remain solid or if commercial ammunition demand improves. In addition, any improvement in construction, manufacturing, and broader industrial activity could lift demand across several of Olin’s end markets at once.
Recent company updates have continued to emphasize operating discipline, cost management, and capital allocation rather than aggressive expansion. That is usually a sensible posture when industry conditions are still uneven. The main opportunity is therefore a normalization of margins from depressed levels, not a transformation of the business model.
Risks
This article is for informational purposes only and does not constitute financial advice. Some content is AI-generated. See Disclaimer


