Stock Analysis · Ollie's Bargain Outlet Hldg (OLLI)
Overview
Ollie’s Bargain Outlet is a U.S. discount retailer focused on closeout merchandise. The company buys excess inventory, packaging changes, canceled orders, overstocks, and other opportunistic deals from manufacturers and suppliers, then sells those products in a no-frills store format at low prices. Its assortment spans everyday consumer categories rather than a single niche, which helps drive repeat traffic and gives the chain flexibility when sourcing bargains.
Revenue is overwhelmingly generated through merchandise sales in physical stores. Based on the company’s reporting structure, Ollie’s operates essentially as a single-segment retailer, so outside revenue streams are very limited.
- Net sales from merchandise sold in stores: approximately 99%+ of revenue. This includes categories such as housewares, food, books and stationery, bed and bath, floor coverings, toys, health and beauty aids, candy, electronics, and seasonal goods.
- Other revenue: likely less than 1%. This mainly relates to incidental items rather than a meaningful separate business line.
The business model is simple: buy cheaply, turn inventory quickly, and attract value-focused shoppers with a constantly changing mix. That makes Ollie’s different from a standard big-box chain with a fixed assortment, because treasure-hunt shopping is part of the appeal.
The profit flow has improved notably over the last several years. Revenue has climbed from roughly $1.8 billion to about $2.6 billion between fiscal 2022 and fiscal 2026, while operating income and net income have expanded faster than sales. That points to both scale benefits and healthier merchandise economics.
The visual breakdown highlights a favorable trend: sales have grown steadily, gross profit has widened, and earnings have increased faster than operating expenses. Selling and administrative costs have risen with expansion, but not enough to prevent margin improvement.
Key Figures
| Metric | Value | Sector ⓘ |
|---|---|---|
| Date | Oct 17, 2026 | |
| Context | ||
| Sector | Consumer Defensive | |
| Industry | Discount Stores | |
| Market Cap ⓘ | $5.13B | |
| Beta ⓘ | 0.41 | |
Value (Cheapness) | ||
| P/E Ratio ⓘ | 19.34 | 17.88 |
| P/B Ratio ⓘ | 2.81 | 1.29 |
| FCF Yield ⓘ | 4.35% | 12.39% |
| Dividend Yield ⓘ | N/A | 2.85% |
| EBIT / EV ⓘ | 6.68% | 6.43% |
| PEG ⓘ | 2.08 | |
Growth (Business expansion) | ||
| Revenue Growth ⓘ | 9.10% | 4.10% |
| RPS Growth (5Y CAGR) ⓘ | 12.24% | 6.18% |
| EPS Growth (5Y CAGR) ⓘ | 10.76% | -13.59% |
| BVPS Growth (5Y CAGR) ⓘ | 11.40% | 3.20% |
| Margin Growth (5Y Trend) ⓘ | -0.03% | -0.15% |
| FCF Growth (5Y CAGR) ⓘ | 109.82% | 4.10% |
| DPS Growth (5Y CAGR) ⓘ | -98.15% | 6.79% |
Quality (Business durability) | ||
| ROIC (Latest) ⓘ | 14.60% | 12.34% |
| ROA (Latest) ⓘ | 9.30% | 6.30% |
| ROIC (5Y Median) ⓘ | 12.58% | 10.49% |
| ROA (5Y Median) ⓘ | 8.23% | 5.44% |
| Net Debt / EBIT (Latest) ⓘ | 1.66 | 1.96 |
| Net Debt / EBIT (5Y Median) ⓘ | 1.32 | 2.35 |
| Net Debt / EBITDA (Latest) ⓘ | 1.43 | 1.38 |
| Net Debt / Assets ⓘ | 19.98% | 21.51% |
| EBITDA / Interest ⓘ | N/A | 9.46 |
| Operating Margin (Latest) ⓘ | 13.03% | 8.87% |
| Operating Margin (5Y Median) ⓘ | 11.53% | 9.53% |
| Debt to Equity (Latest) ⓘ | 38.28% | 72.35% |
| Profit Margin (Latest) ⓘ | 9.80% | 5.40% |
| Free Cash Flow (Latest) ⓘ | $223.24M | |
Momentum (Price trend) | ||
| 3Y Return ⓘ | +19.62% | +20.92% |
| 12M Return (excl. last month) ⓘ | -44.07% | +2.13% |
| 6M Return ⓘ | -3.66% | +1.26% |
| Price vs. 200-Day MA ⓘ | -0.31% | +1.39% |
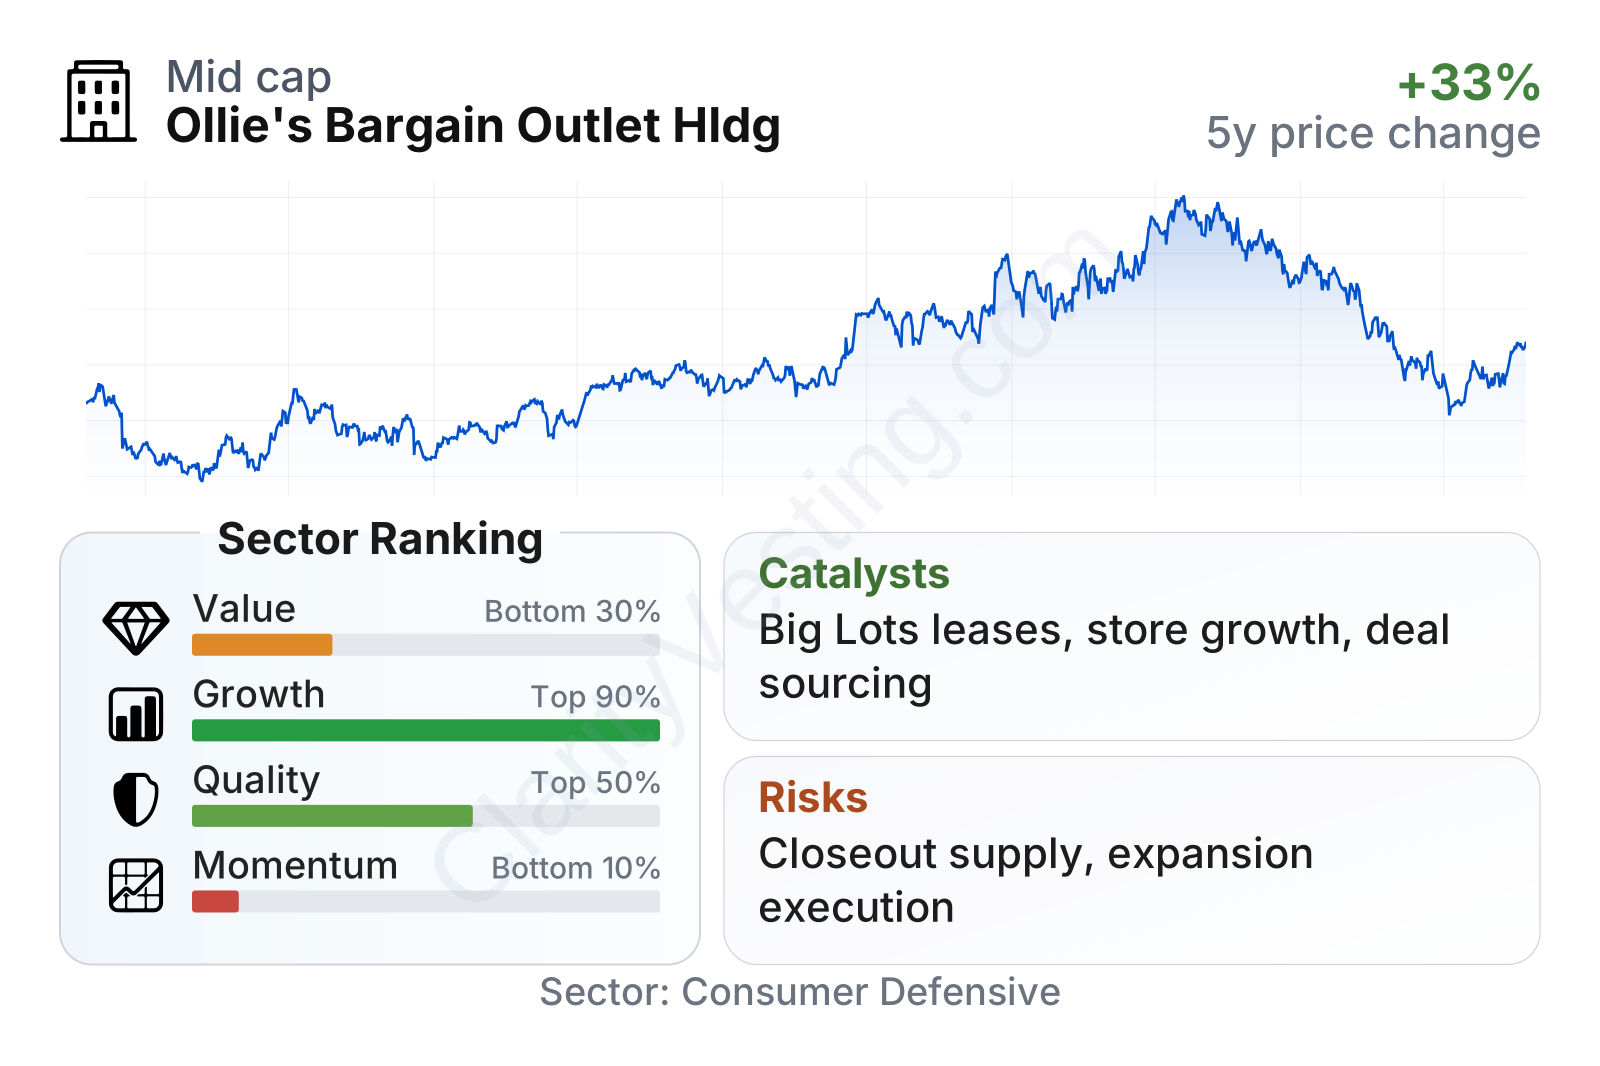
Ollie’s stands out more for growth and operating execution than for traditional cheapness. Growth ranks near the top of its sector, quality is solid, and leverage remains moderate. By contrast, value metrics look less attractive on measures such as price-to-book and free-cash-flow yield, while recent share-price momentum has been weak after a large decline from earlier highs. The company is mid-sized, and its low beta suggests the stock has historically moved less than the broader market.
Growth
Discount retail is a resilient part of consumer spending because it tends to benefit both when household budgets are tight and when shoppers become more price-conscious. That does not make the sector immune to downturns, but it does give chains like Ollie’s a practical long-term role in the retail landscape. Closeout retail also gains relevance when supply chains normalize and branded suppliers need help clearing excess goods.
Ollie’s strategy for expansion is straightforward and credible. The company continues to open new stores, enters additional markets, and uses its flexible buying model to source branded goods at discounted prices. Its customer proposition is easy to understand: recognizable products, changing assortments, and visibly lower prices. That combination can travel well across geographies if execution remains disciplined.
Recent revenue growth has remained positive throughout the latest periods, though the pace has cooled from earlier peaks. Even with that moderation, the current annual growth rate is still well above the sector median, and the five-year revenue-per-share trend remains strong. This matters because it suggests expansion has not relied only on issuing more shares or on short-lived pricing effects.
Cash generation has also strengthened materially over time. Free cash flow moved from a modest level a few years ago to roughly $200 million recently, despite some year-to-year unevenness. For a retailer still expanding its footprint, that is important: store growth funded by internally generated cash is generally a healthier pattern than aggressive debt-funded expansion.
A meaningful catalyst in recent years has been the acquisition of former Big Lots store leases, which gives Ollie’s a chance to accelerate expansion into already established retail locations. That can reduce some of the friction normally associated with site selection and market entry. The company has also discussed a large long-term white-space opportunity for additional stores in the U.S., which supports the idea that the chain is still far from saturation.
Risks
This article is for informational purposes only and does not constitute financial advice. Some content is AI-generated. See Disclaimer


