Stock Analysis · Oceaneering International Inc (OII)
Overview
Oceaneering International is an engineering and services company that works mostly in offshore energy, while also serving defense, aerospace, manufacturing, and other industrial markets. Its best-known activities include remotely operated vehicles used underwater, subsea hardware and intervention tools, asset inspection and integrity services, and specialized manufactured products. In simpler terms, the company helps customers build, maintain, inspect, and operate difficult-to-access equipment, especially in deepwater environments.
The business is still closely tied to offshore oil and gas, but it is not a pure drilling bet. A meaningful part of its work comes from service-heavy and technology-heavy activities that can generate repeat revenue from installed equipment, vessel support, inspections, and maintenance. In recent years, profitability has improved as revenue expanded and operating income recovered from the weak period earlier in the decade.
Based on the company’s recent annual reporting structure, revenue is spread across several operating segments rather than one single product line.
- Subsea Robotics: approximately 34% of revenue. This includes remotely operated vehicles, tool rental services, and integrated offshore project support.
- Manufactured Products: approximately 26% of revenue. This segment includes subsea connectors, umbilical hardware, valves, and other specialized products used in offshore and industrial applications.
- Offshore Projects Group: approximately 16% of revenue. This covers vessel-based services, subsea installation, inspection, repair, and maintenance work.
- Integrity Management & Digital Solutions: approximately 12% of revenue. This includes asset integrity, inspection, software, and analytics services.
- Aerospace and Defense Technologies: approximately 12% of revenue. This business provides engineering and mission-support solutions, including work tied to government and defense customers.
This mix matters because it shows a company that is still energy-centered, but less dependent on one narrow activity than many traditional oilfield service peers. It also helps explain why margins and cash generation have been improving as offshore spending has recovered.
The long-term pattern is encouraging: revenue has climbed steadily since 2021, while operating income and net income have improved much faster than sales. That suggests the recent recovery has not only been about higher activity levels, but also about better execution and a healthier business mix.
Key Figures
| Metric | Value | Sector ⓘ |
|---|---|---|
| Date | Oct 17, 2026 | |
| Context | ||
| Sector | Energy | |
| Industry | Oil & Gas Equipment & Services | |
| Market Cap ⓘ | $4.46B | |
| Beta ⓘ | 1.25 | |
Value (Cheapness) | ||
| P/E Ratio ⓘ | 12.95 | 15.44 |
| P/B Ratio ⓘ | 3.76 | 1.73 |
| FCF Yield ⓘ | 5.01% | 8.20% |
| Dividend Yield ⓘ | N/A | 3.59% |
| EBIT / EV ⓘ | 6.44% | 7.46% |
| PEG ⓘ | 8.01 | |
Growth (Business expansion) | ||
| Revenue Growth ⓘ | 10.00% | 26.90% |
| RPS Growth (5Y CAGR) ⓘ | 10.05% | 6.90% |
| EPS Growth (5Y CAGR) ⓘ | 36.01% | -15.73% |
| BVPS Growth (5Y CAGR) ⓘ | 20.03% | 6.07% |
| Margin Growth (5Y Trend) ⓘ | 9.83% | 0.58% |
| FCF Growth (5Y CAGR) ⓘ | 4.38% | 1.86% |
| DPS Growth (5Y CAGR) ⓘ | N/A | 16.79% |
Quality (Business durability) | ||
| ROIC (Latest) ⓘ | 26.40% | 11.40% |
| ROA (Latest) ⓘ | 13.39% | 6.06% |
| ROIC (5Y Median) ⓘ | 13.23% | 10.30% |
| ROA (5Y Median) ⓘ | 4.56% | 5.42% |
| Net Debt / EBIT (Latest) ⓘ | 0.63 | 1.64 |
| Net Debt / EBIT (5Y Median) ⓘ | 1.96 | 1.83 |
| Net Debt / EBITDA (Latest) ⓘ | 0.47 | 1.08 |
| Net Debt / Assets ⓘ | 7.17% | 17.29% |
| EBITDA / Interest ⓘ | 11.51 | 9.64 |
| Operating Margin (Latest) ⓘ | 10.70% | 16.27% |
| Operating Margin (5Y Median) ⓘ | 8.15% | 20.39% |
| Debt to Equity (Latest) ⓘ | 70.34% | 54.76% |
| Profit Margin (Latest) ⓘ | 12.19% | 8.82% |
| Free Cash Flow (Latest) ⓘ | $223.24M | |
Momentum (Price trend) | ||
| 3Y Return ⓘ | +73.70% | +67.38% |
| 12M Return (excl. last month) ⓘ | +91.92% | +49.19% |
| 6M Return ⓘ | +21.15% | +7.07% |
| Price vs. 200-Day MA ⓘ | +10.57% | +9.56% |
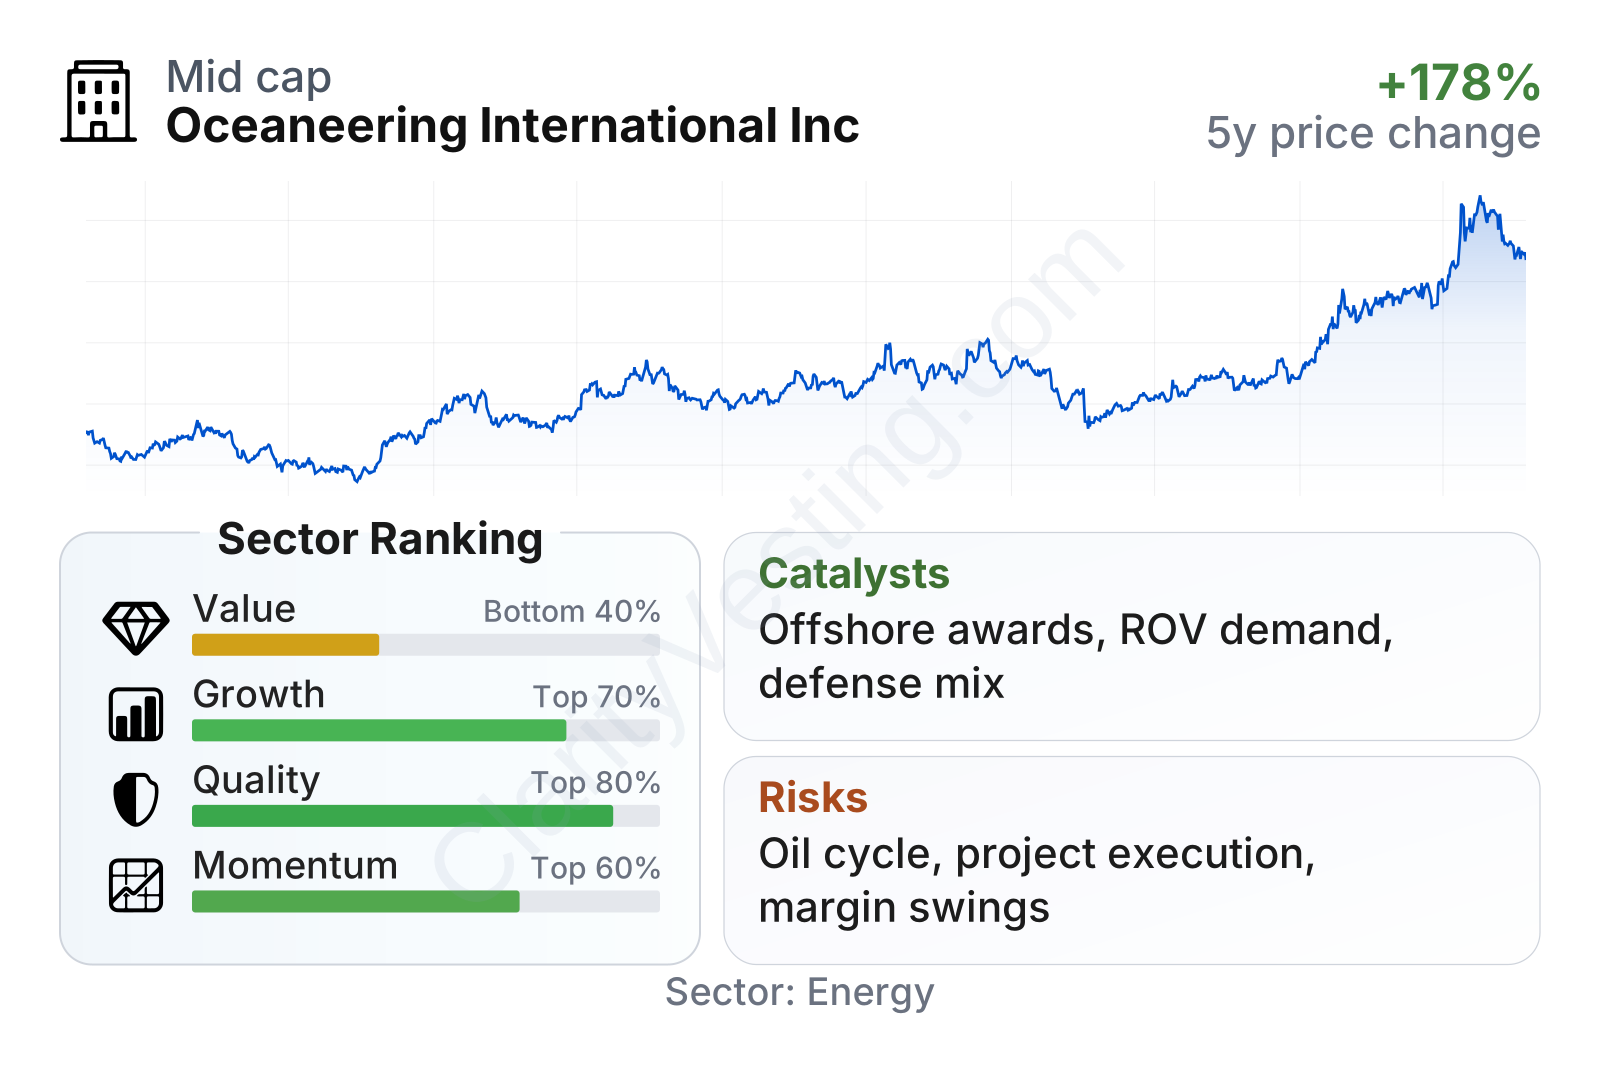
Oceaneering looks like a mid-sized energy services company with a share price that has been strong over the last several years, especially in the most recent 12 months. On fundamentals, the profile is mixed in a useful way: quality and balance-sheet metrics are generally stronger than many sector peers, while value is less compelling because the market has already recognized part of the turnaround. Growth metrics are above sector medians on a multiyear basis, even if the latest year-over-year revenue pace is not especially fast compared with some energy names.
The table also points to an important distinction. Returns on capital, cash generation, and earnings progression have improved meaningfully, but traditional valuation measures do not suggest a clear bargain. In other words, the operating recovery is visible, and part of that improvement already appears reflected in the stock.
Growth
Oceaneering operates in a part of the energy market that still has a future, especially where offshore production remains economically attractive. Deepwater developments have become more disciplined than in past cycles, and large energy producers continue to need subsea inspection, intervention, robotics, and specialized hardware over the life of their fields. That creates demand not only when new projects are approved, but also when existing offshore assets need maintenance and performance support.
The company’s strategy also makes practical sense for long-term growth because it is not relying on one single theme. Its robotics, manufactured products, and offshore services businesses are directly connected to offshore activity, while its integrity, digital, aerospace, and defense activities provide additional diversification. That does not remove cyclicality, but it can soften the impact of sudden slowdowns in one niche.
Revenue growth has remained positive in most recent periods, though it has moderated from the sharper rebound seen in 2023. That is not unusual after a strong recovery phase. More important is that the company has been able to build on its earlier sales recovery rather than give it back, which supports the idea that the business is in a more durable upcycle than a short-lived spike.
Cash generation has strengthened materially, with trailing free cash flow moving well above the levels seen in earlier years. For a capital-intensive service company, that is a major signal. It means more flexibility for debt reduction, reinvestment, acquisitions, or shareholder returns if management chooses. It also reduces dependence on favorable external financing conditions.
Recent company updates have emphasized order activity and execution across offshore and manufactured-product lines, along with ongoing support from defense-related work. The clearest catalyst is continued offshore project activity, especially in subsea systems and intervention services, combined with the possibility that defense and non-energy technology programs become a larger contributor over time. If both sides advance together, the company could continue shifting from a cyclical recovery case toward a steadier industrial-technology profile.
Risks
This article is for informational purposes only and does not constitute financial advice. Some content is AI-generated. See Disclaimer


