Stock Analysis · OGE Energy Corporation (OGE)
Overview
OGE Energy Corporation is a regulated electric utility based in the south-central United States. Its core business is OG&E, which generates, transmits, distributes, and sells electricity to customers across Oklahoma and western Arkansas. For a long-term reader, the most important point is that this is not a fast-changing technology company or a cyclical manufacturer. It is primarily a local electricity provider operating under state regulation, which usually means steadier demand, planned infrastructure spending, and earnings that are closely tied to approved customer rates and service reliability.
The company’s revenue is overwhelmingly tied to electricity service. Based on recent annual reporting, the business mix is highly concentrated in the regulated utility segment.
- Electricity sales to residential, commercial, and industrial customers: about 90% to 95%. This is the main activity and includes the sale and delivery of power within OG&E’s service territory.
- Other electric utility revenues: about 5% to 10%. This generally includes transmission-related revenue, service fees, and smaller regulated utility items.
- Non-utility activities: minimal. OGE has become much more focused than it was years ago, with very limited contribution from businesses outside the regulated electric operation.
That concentration makes OGE relatively easy to understand: its performance depends mostly on customer growth in its service area, weather patterns, electricity demand, regulatory decisions, and its ability to earn approved returns on capital investments.
The financial flow over the last several years shows a business with revenue that fell materially in 2023 and then recovered in 2024 and 2025. Even with that volatility, profitability remained positive, and gross profit held up better than total revenue, which suggests some resilience in the underlying regulated model. Interest expense has been trending higher, however, which matters because utilities rely heavily on debt to finance grids, generation, and reliability upgrades.
Key Figures
| Metric | Value | Sector ⓘ |
|---|---|---|
| Date | Oct 17, 2026 | |
| Context | ||
| Sector | Utilities | |
| Industry | Utilities - Regulated Electric | |
| Market Cap ⓘ | $9.75B | |
| Beta ⓘ | 0.49 | |
Value (Cheapness) | ||
| P/E Ratio ⓘ | 20.80 | 17.28 |
| P/B Ratio ⓘ | 1.98 | 1.51 |
| FCF Yield ⓘ | 12.40% | 0.65% |
| Dividend Yield ⓘ | 3.62% | 3.77% |
| EBIT / EV ⓘ | 5.30% | 5.01% |
| PEG ⓘ | 2.99 | |
Growth (Business expansion) | ||
| Revenue Growth ⓘ | -4.00% | 6.10% |
| RPS Growth (5Y CAGR) ⓘ | -3.07% | 3.87% |
| EPS Growth (5Y CAGR) ⓘ | -23.09% | -11.30% |
| BVPS Growth (5Y CAGR) ⓘ | 4.96% | 4.23% |
| Margin Growth (5Y Trend) ⓘ | -2.99% | 3.57% |
| FCF Growth (5Y CAGR) ⓘ | N/A | -8.84% |
| DPS Growth (5Y CAGR) ⓘ | 1.01% | 4.84% |
Quality (Business durability) | ||
| ROIC (Latest) ⓘ | 6.36% | 6.53% |
| ROA (Latest) ⓘ | 3.26% | 3.20% |
| ROIC (5Y Median) ⓘ | 6.74% | 5.95% |
| ROA (5Y Median) ⓘ | 3.35% | 2.75% |
| Net Debt / EBIT (Latest) ⓘ | 7.31 | 7.13 |
| Net Debt / EBIT (5Y Median) ⓘ | 6.81 | 7.23 |
| Net Debt / EBITDA (Latest) ⓘ | 4.32 | 4.31 |
| Net Debt / Assets ⓘ | 39.94% | 38.42% |
| EBITDA / Interest ⓘ | 7.25 | 4.58 |
| Operating Margin (Latest) ⓘ | 24.71% | 20.83% |
| Operating Margin (5Y Median) ⓘ | 25.97% | 20.08% |
| Debt to Equity (Latest) ⓘ | 117.31% | 137.69% |
| Profit Margin (Latest) ⓘ | 14.44% | 11.37% |
| Free Cash Flow (Latest) ⓘ | $1.21B | |
Momentum (Price trend) | ||
| 3Y Return ⓘ | +57.29% | +52.37% |
| 12M Return (excl. last month) ⓘ | +7.84% | +8.84% |
| 6M Return ⓘ | -0.94% | -3.95% |
| Price vs. 200-Day MA ⓘ | +3.29% | -0.79% |
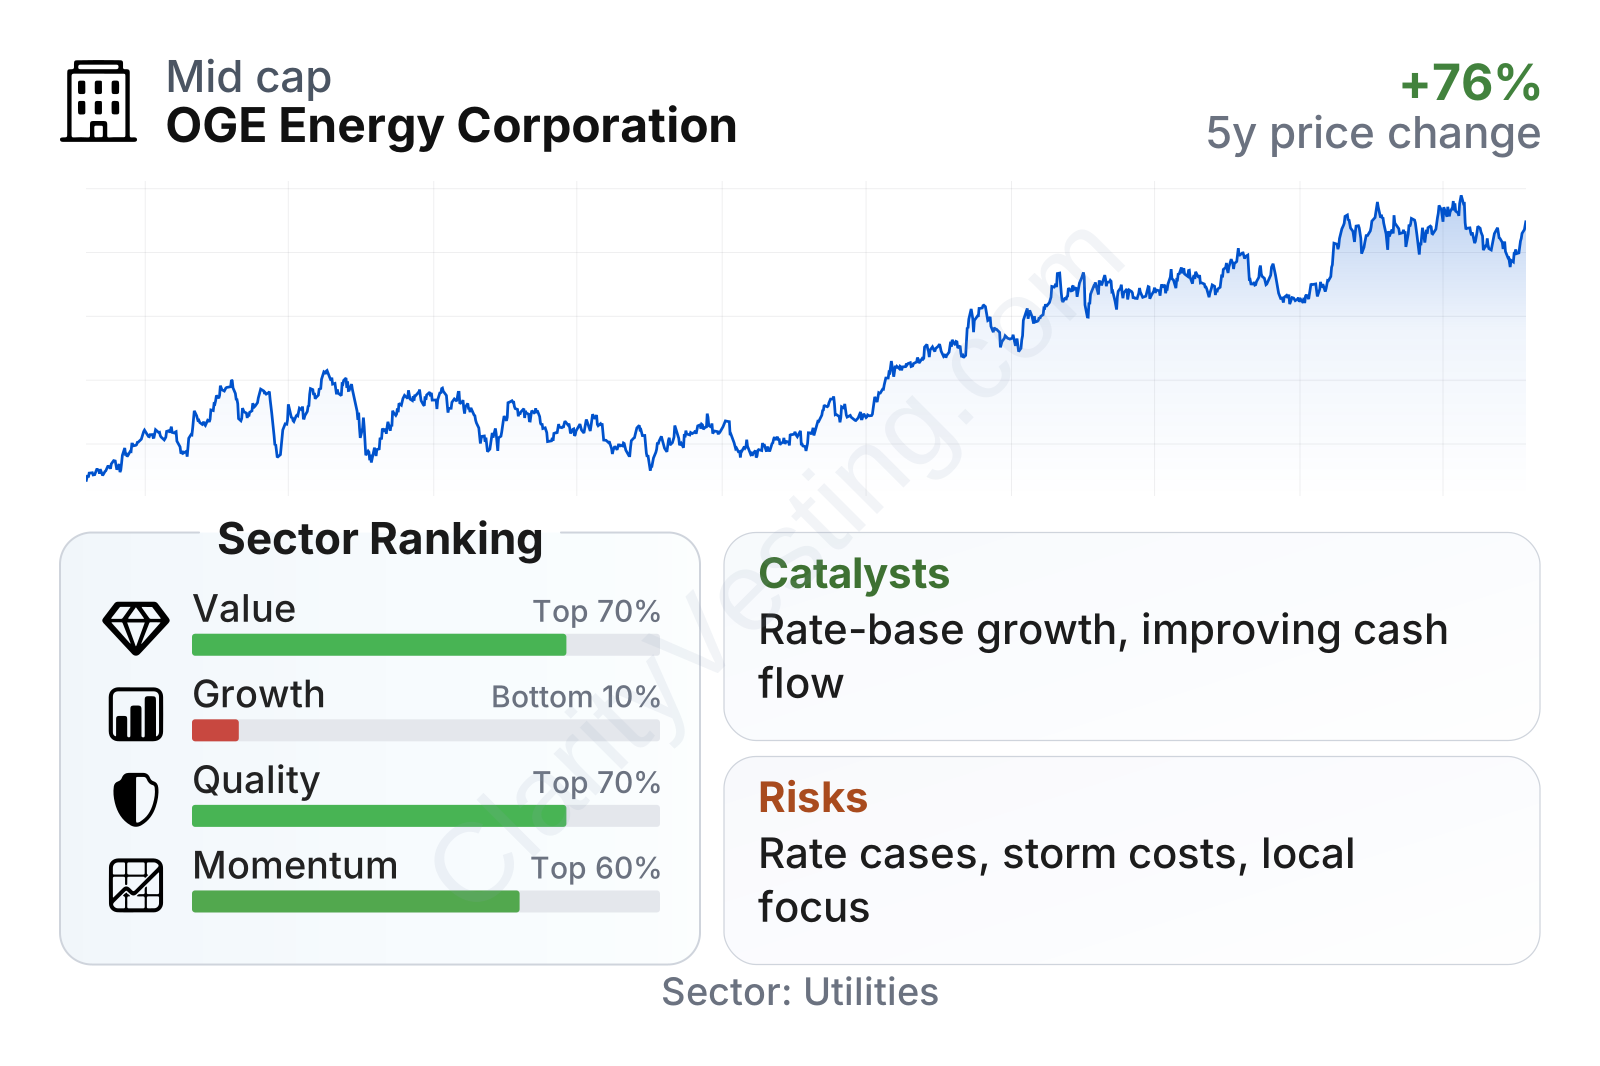
OGE is a mid-sized utility with a low share-price volatility profile, reflected in a beta near 0.5. In plain English, the stock has historically moved less than the broader market. The broad picture from the metrics is mixed but understandable for a regulated utility: profitability and balance-sheet discipline look better than many sector peers, while growth is clearly the weak point. Value measures are not especially cheap relative to the utility group, and recent price momentum has been softer than the sector median despite strong multi-year performance.
The latest factor breakdown points to a company with solid operating quality rather than strong expansion. Margins, returns on assets, and interest coverage compare reasonably well within regulated utilities, while revenue and earnings growth rates rank near the bottom of the sector. That combination usually fits a stable utility that can produce cash and maintain service reliability, but is not currently delivering rapid business expansion.
Growth
OGE operates in a sector with durable long-term relevance. Electricity demand is essential, and the grid needs constant maintenance and modernization. In addition, U.S. power demand is receiving renewed support from data centers, manufacturing reshoring, electrification, and population shifts into lower-cost states. OGE’s service territory is not one of the largest in the country, but Oklahoma and Arkansas offer a practical utility growth case: population gains in certain areas, ongoing infrastructure needs, and room for regulated capital investment.
For utilities, growth is usually not about launching new products. It comes from expanding the regulated asset base and earning an authorized return on investments such as transmission lines, substations, generation upgrades, and grid hardening. OGE’s strategy broadly follows that model. If regulators approve capital plans and rate recovery, new spending can support incremental earnings over time.
Revenue per share has not shown a strong long-term upward slope over the last five years. There was a notable decline through 2023 followed by a recovery in 2024 and 2025, but the broader trend still supports the view that OGE is a slow-growth utility rather than a company in an expansion phase. This matches the weak growth ranking in the latest metrics.
Free cash flow has improved sharply after several periods of pressure. That matters because utilities often go through years when capital spending absorbs most operating cash. A move back to strongly positive free cash flow can ease concerns around financing needs, support dividends, and provide more flexibility for future investment. It does not eliminate capital intensity, but it does improve the company’s financial breathing room.
Recent company updates in 2026 have continued to emphasize capital investment, reliability, and regulatory execution as the main drivers of future performance. For OGE, the clearest catalyst is not a single breakthrough event. It is the combination of rate-base growth, service territory demand, and recovery of investment through approved rates. If electricity demand in its region strengthens further, especially from commercial and industrial customers, that would add to the opportunity.
Risks
This article is for informational purposes only and does not constitute financial advice. Some content is AI-generated. See Disclaimer


