Stock Analysis · Empire State Realty OP LP (OGCP)
Overview
Empire State Realty OP LP is the operating partnership behind Empire State Realty Trust, a New York-focused real estate company organized as a REIT. Its business is centered on owning, managing, leasing, and repositioning office properties, with a portfolio concentrated in Manhattan and the greater New York City area. It also owns the Empire State Building Observatory, which gives the company a second major activity beyond traditional property rental.
This mix matters because the company is not only an office landlord. It combines recurring rent from commercial tenants with tourism-driven revenue from one of the most recognized buildings in the world. That makes its business model more diversified than many pure office REITs, although New York City remains the clear geographic concentration.
Based on recent company reporting, the main sources of revenue are approximately:
- Office rental revenue: about 60% to 70% of total revenue. This includes rent from office tenants, escalations, and related tenant reimbursements across the company’s office portfolio.
- Observatory revenue: about 25% to 35% of total revenue. This comes primarily from ticket sales and related visitor activity at the Empire State Building Observatory.
- Retail and other property-related revenue: about 5% to 10% of total revenue. This includes retail rent and other building-related income.
The broad financial picture over the last several years shows revenue recovering and then stabilizing after the pandemic period, while interest expense has stayed meaningful and profitability has remained relatively thin for a property owner of this type. The Observatory continues to be a distinctive earnings contributor within the portfolio.
Key Figures
| Metric | Value | Sector ⓘ |
|---|---|---|
| Date | Oct 17, 2026 | |
| Context | ||
| Sector | Real Estate | |
| Industry | REIT - Office | |
| Market Cap ⓘ | $1.29B | |
| Beta ⓘ | 1.46 | |
Value (Cheapness) | ||
| P/E Ratio ⓘ | 231.00 | 17.38 |
| P/B Ratio ⓘ | 0.71 | 0.85 |
| FCF Yield ⓘ | 16.48% | 7.38% |
| Dividend Yield ⓘ | 2.98% | 4.85% |
| EBIT / EV ⓘ | 3.53% | 3.78% |
| PEG ⓘ | N/A | |
Growth (Business expansion) | ||
| Revenue Growth ⓘ | 3.20% | 5.30% |
| RPS Growth (5Y CAGR) ⓘ | 6.05% | 6.02% |
| EPS Growth (5Y CAGR) ⓘ | N/A | -11.37% |
| BVPS Growth (5Y CAGR) ⓘ | -10.15% | 0.45% |
| Margin Growth (5Y Trend) ⓘ | 10.58% | -0.22% |
| FCF Growth (5Y CAGR) ⓘ | -30.16% | 5.40% |
| DPS Growth (5Y CAGR) ⓘ | 8.82% | 5.02% |
Quality (Business durability) | ||
| ROIC (Latest) ⓘ | 2.61% | 5.69% |
| ROE (Latest) ⓘ | 0.89% | 7.56% |
| ROA (Latest) ⓘ | 0.30% | 2.85% |
| ROIC (5Y Median) ⓘ | 4.11% | 4.22% |
| ROE (5Y Median) ⓘ | 3.57% | 6.03% |
| ROA (5Y Median) ⓘ | 1.50% | 2.44% |
| Net Debt / EBIT (Latest) ⓘ | 18.60 | 7.59 |
| Net Debt / EBIT (5Y Median) ⓘ | 12.86 | 8.40 |
| Net Debt / EBITDA (Latest) ⓘ | 6.84 | 5.27 |
| Net Debt / Assets ⓘ | 50.98% | 37.76% |
| EBITDA / Interest ⓘ | 2.97 | 4.10 |
| Operating Margin (Latest) ⓘ | 14.94% | 35.29% |
| Operating Margin (5Y Median) ⓘ | 21.83% | 37.31% |
| Debt to Equity (Latest) ⓘ | 126.49% | 88.87% |
| Profit Margin (Latest) ⓘ | 1.18% | 19.61% |
| Free Cash Flow (Latest) ⓘ | $213.30M | |
Momentum (Price trend) | ||
| 3Y Return ⓘ | -37.78% | +30.75% |
| 12M Return (excl. last month) ⓘ | -42.44% | +4.36% |
| 6M Return ⓘ | -11.70% | -2.52% |
| Price vs. 200-Day MA ⓘ | -20.00% | -2.34% |
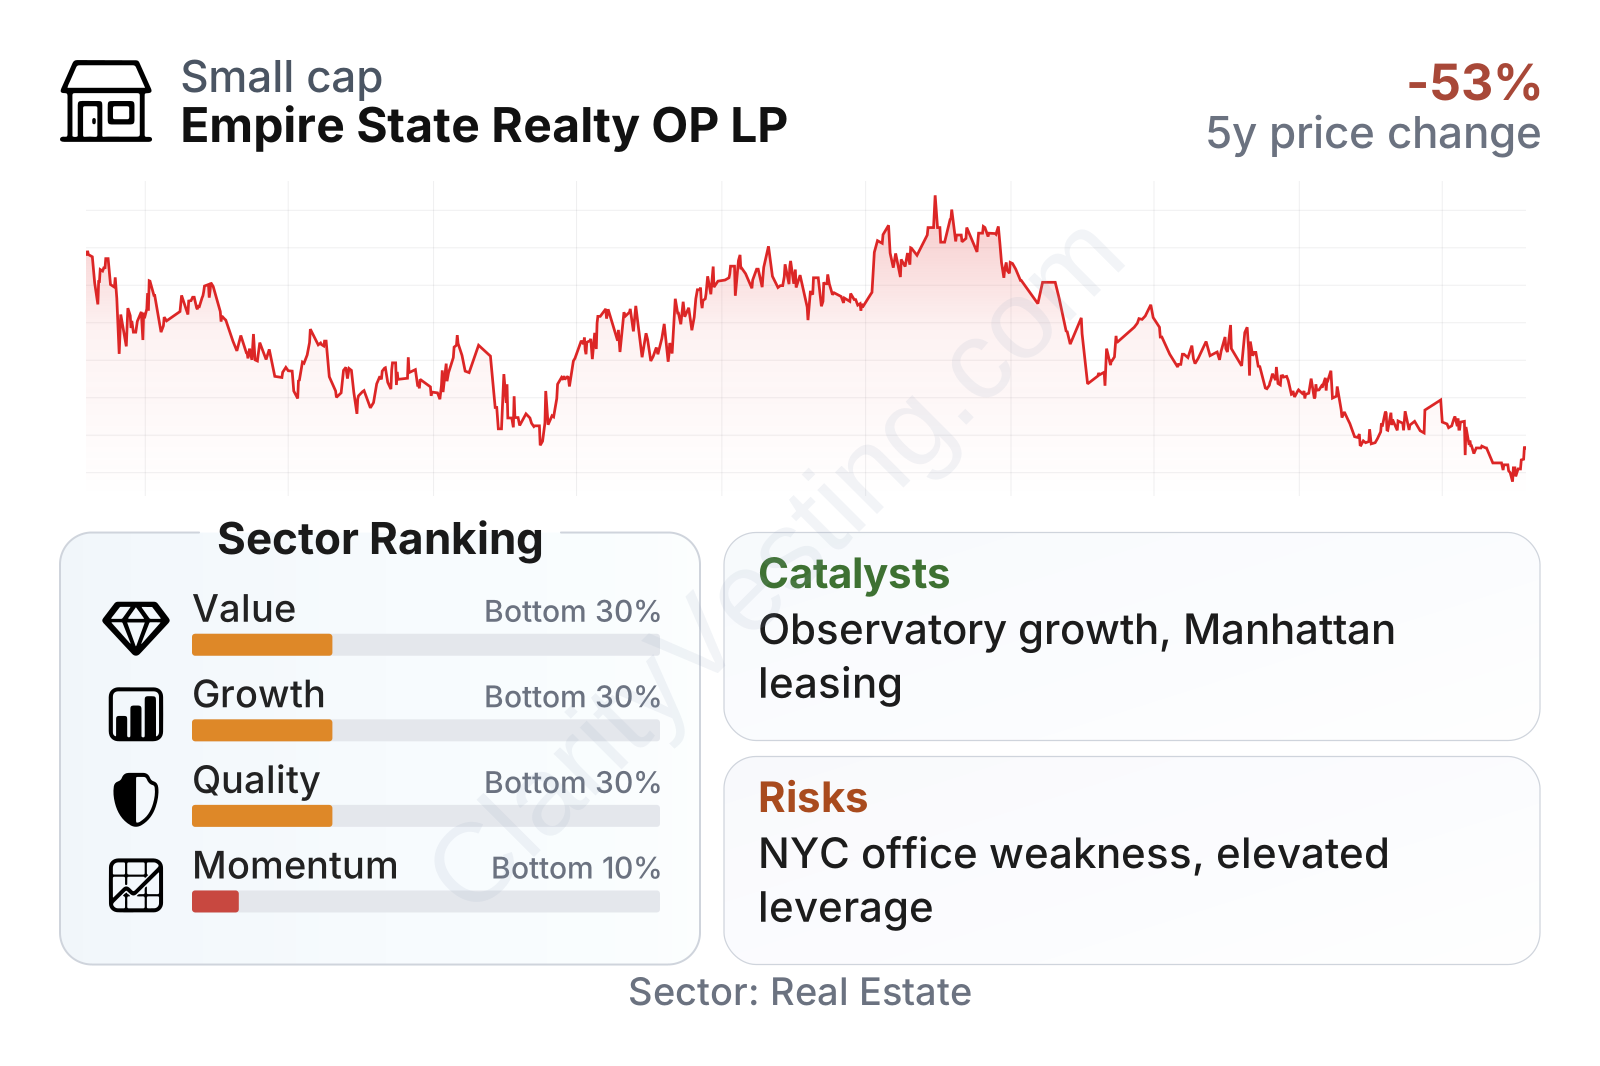
Empire State Realty OP LP is a small-cap real estate company with above-average share price volatility. The factor profile is mixed: cash generation looks strong relative to its market value, but growth, profitability, balance-sheet efficiency, and stock momentum all rank weakly versus much of the real estate sector. The very high earnings multiple is not especially useful on its own here because net income is small relative to the company’s asset base, while the price-to-book ratio sits below the sector median, pointing to a market that is assigning a discount to the underlying real estate.
Growth
Empire State Realty OP LP operates in an office market that is still working through structural change. That is not an easy backdrop. Remote and hybrid work have reduced demand for weaker office properties across many U.S. cities, especially in older buildings. At the same time, better-located and upgraded assets in major business districts have held up better than lower-quality space. The company’s focus on Manhattan gives it exposure to one of the deepest office markets in the country, but also one of the most scrutinized.
The company’s strategy is sensible within that context. It has emphasized premium assets, energy efficiency upgrades, amenity improvements, and leasing execution in a market where tenants are increasingly selective. The Empire State Building itself is an example of a property where brand recognition, location, and continued modernization can help preserve relevance. The Observatory adds a second growth lever that is tied more to tourism and visitor spending than to office leasing cycles.
Revenue per share improved steadily from 2021 through 2024 and then leveled off in 2025. That pattern suggests the company was able to rebuild top-line performance after the pandemic disruption, but it has not yet entered a clearly stronger expansion phase. Recent year-over-year revenue growth is positive, though slower than the sector median.
The dividend per share has risen materially over five years, even with some unevenness along the way. That reflects improved operating recovery compared with the low pandemic base, but the current yield remains below the sector median, so income is not the company’s main differentiator.
A meaningful catalyst is the Observatory business. Visitor volumes and pricing power can create earnings upside that many office landlords simply do not have. Another catalyst is leasing in top-tier Manhattan properties if the flight-to-quality trend continues. If tenants keep favoring landmark and renovated buildings over commodity office space, the company may be better positioned than weaker office owners. Recent company updates have also continued to emphasize leasing activity, portfolio occupancy management, and balance-sheet discipline, which are central to whether earnings can improve from here.
Risks
This article is for informational purposes only and does not constitute financial advice. Some content is AI-generated. See Disclaimer


