Stock Analysis · OceanaGold Corporation (OGC)
Overview
OceanaGold Corporation is a mid-sized gold producer that operates mines in the Philippines, New Zealand, and the United States. Its business is straightforward: it extracts gold and, to a lesser extent, copper and silver, then sells those metals into global commodity markets. For long-term analysis, the central point is that OceanaGold is mainly a gold company, so its results are heavily influenced by production volumes, operating costs, and the gold price.
The company’s producing assets are led by Haile in the United States, Didipio in the Philippines, and Macraes and Waihi in New Zealand. Didipio is especially important because it is a gold-copper operation, which gives OceanaGold some by-product diversification compared with a pure gold miner. The company is also advancing growth work around Waihi, including the underground expansion pipeline that is meant to extend mine life and raise future output.
Based on recent annual disclosures, revenue is dominated by gold sales, with copper and silver contributing a much smaller share.
- Gold: approximately 85% to 90% of revenue. This comes from doré and concentrate sales across the operating mines.
- Copper: approximately 8% to 12% of revenue. This is mainly tied to Didipio, where copper production helps offset overall mining costs.
- Silver and other: approximately 1% to 3% of revenue. This is a minor by-product contribution.
That mix matters because it means OceanaGold offers strong exposure to gold while still benefiting from a secondary copper stream. It also means the company is less diversified than major global miners, since a limited number of mines account for nearly all operating performance.
The recent financial flow points to a business that has scaled up meaningfully: revenue and operating income expanded sharply through 2025, while interest expense stayed relatively contained. That combination suggests improved operating leverage during a stronger metal-price environment, although mining results can be volatile from year to year.
Key Figures
| Metric | Value | Sector ⓘ |
|---|---|---|
| Date | Oct 24, 2026 | |
| Context | ||
| Sector | Basic Materials | |
| Industry | Gold | |
| Market Cap ⓘ | $5.87B | |
| Beta ⓘ | 1.50 | |
Value (Cheapness) | ||
| P/E Ratio ⓘ | 7.08 | 16.92 |
| P/B Ratio ⓘ | 2.47 | 1.66 |
| FCF Yield ⓘ | 12.32% | 5.83% |
| Dividend Yield ⓘ | 0.90% | 2.07% |
| EBIT / EV ⓘ | 22.42% | 6.38% |
| PEG ⓘ | N/A | |
Growth (Business expansion) | ||
| Revenue Growth ⓘ | 49.70% | 11.25% |
| RPS Growth (5Y CAGR) ⓘ | 25.30% | 4.49% |
| EPS Growth (5Y CAGR) ⓘ | 42.12% | -15.24% |
| BVPS Growth (5Y CAGR) ⓘ | 9.12% | 5.49% |
| Margin Growth (5Y Trend) ⓘ | 29.90% | -1.54% |
| FCF Growth (5Y CAGR) ⓘ | 83.91% | 0.37% |
| DPS Growth (5Y CAGR) ⓘ | N/A | 5.91% |
Quality (Business durability) | ||
| ROIC (Latest) ⓘ | N/A | 9.59% |
| ROA (Latest) ⓘ | 26.68% | 4.92% |
| ROIC (5Y Median) ⓘ | N/A | 7.91% |
| ROA (5Y Median) ⓘ | 7.59% | 3.92% |
| Net Debt / EBIT (Latest) ⓘ | -0.48 | 1.36 |
| Net Debt / EBIT (5Y Median) ⓘ | 0.54 | 1.69 |
| Net Debt / EBITDA (Latest) ⓘ | -0.38 | 0.93 |
| Net Debt / Assets ⓘ | -16.79% | 13.69% |
| EBITDA / Interest ⓘ | 117.03 | 12.38 |
| Operating Margin (Latest) ⓘ | 51.38% | 13.24% |
| Operating Margin (5Y Median) ⓘ | 19.60% | 11.82% |
| Debt to Equity (Latest) ⓘ | 1.98% | 40.30% |
| Profit Margin (Latest) ⓘ | 35.14% | 6.38% |
| Free Cash Flow (Latest) ⓘ | $723.44M | |
Momentum (Price trend) | ||
| 3Y Return ⓘ | +392.52% | +73.47% |
| 12M Return (excl. last month) ⓘ | +40.78% | +27.59% |
| 6M Return ⓘ | -19.09% | -4.02% |
| Price vs. 200-Day MA ⓘ | -11.71% | -0.65% |
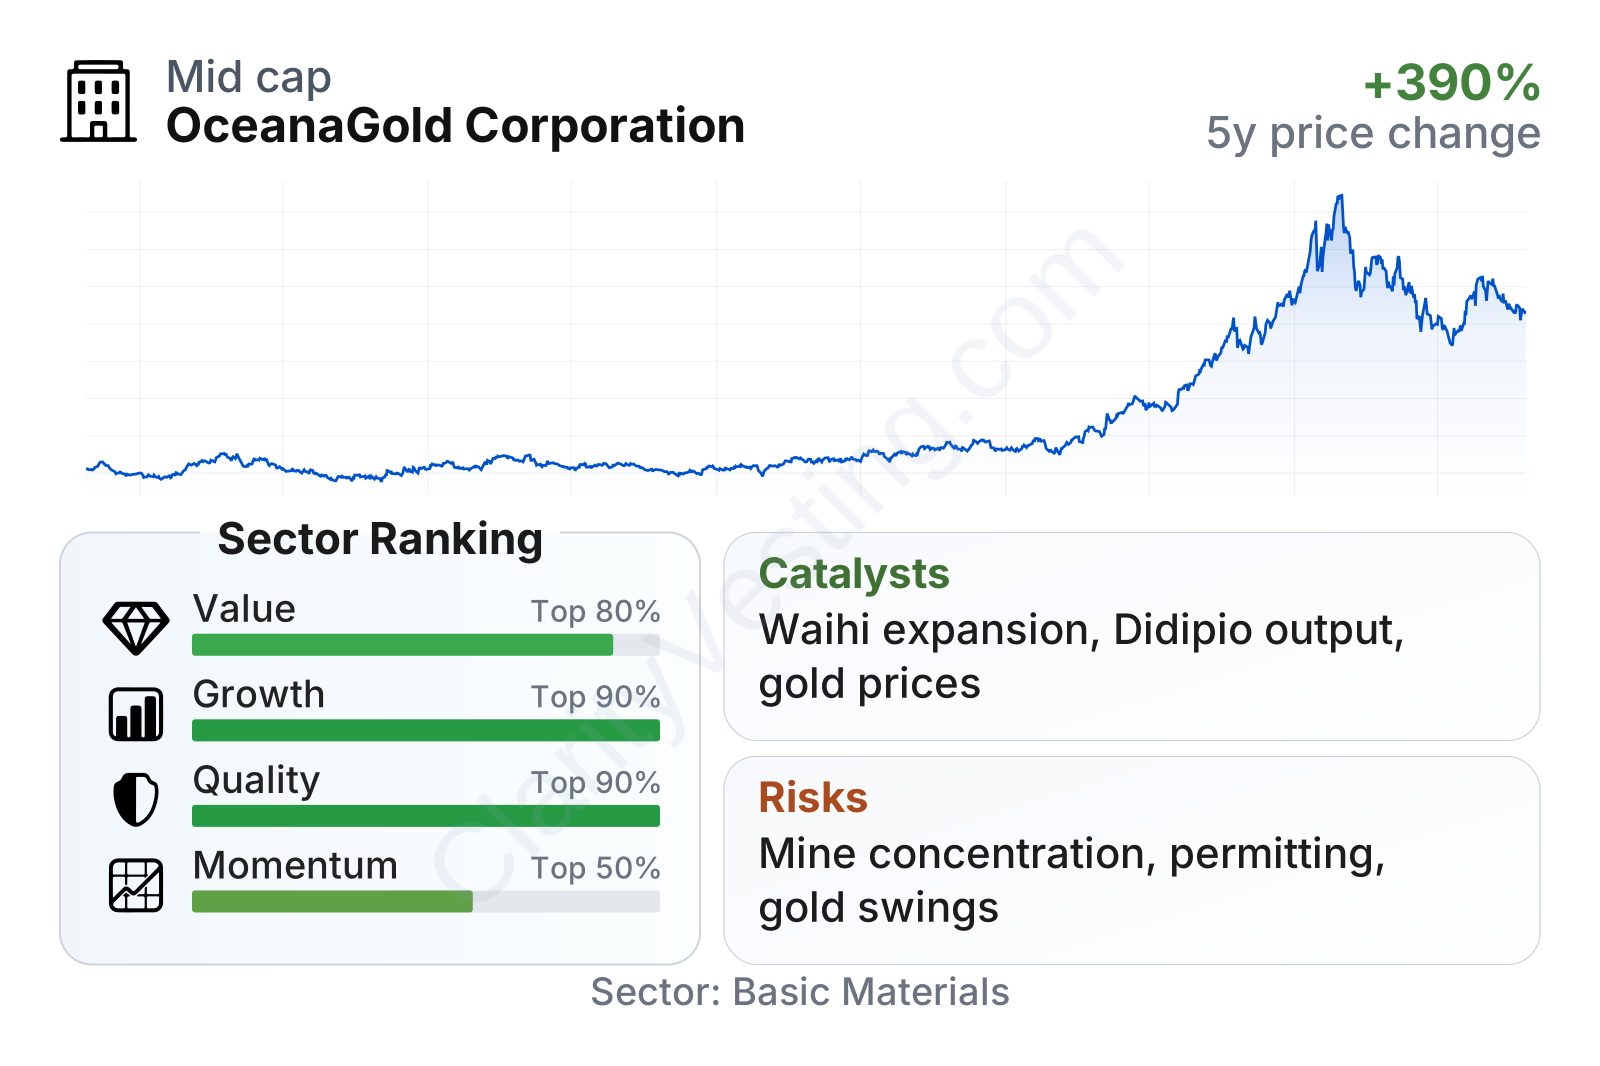
OceanaGold currently stands out for strong growth and quality metrics relative to most gold peers. Revenue growth, earnings growth, margin expansion, and free cash flow generation are all well ahead of the sector median. The balance sheet is also unusually clean for a miner, with very low debt and even a net cash position on some measures. On valuation, the shares screen as inexpensive on earnings and cash flow, although the price-to-book ratio is somewhat richer than the sector median, which suggests the market is assigning value to asset quality and recent execution.
The stock’s historical path also shows how cyclical the market’s view can be. The share price rose dramatically from 2024 into early 2026 before giving back part of that move, which is typical for mining equities when commodity expectations and risk appetite shift quickly.
Growth
Gold mining remains a structurally relevant sector for long-term capital markets because gold serves several roles at once: jewelry demand, central bank reserves, industrial use, and a store of value during inflation or geopolitical stress. That does not make the sector a steady compounder in the way some software or healthcare businesses can be, but it does mean gold producers can benefit from long multi-year periods of favorable pricing. For OceanaGold, the backdrop has recently been supportive.
The company’s strategy for future growth is sensible because it is not relying on a single high-risk megaproject. Instead, it is combining production from existing mines with expansion and resource conversion work around its current portfolio. At Waihi in New Zealand, the company has been pushing forward underground growth opportunities, which could support a step-up in future production. At Haile, operational improvements and mine development remain central to sustaining output. Didipio continues to provide a valuable mix of gold and copper exposure.
Recent revenue growth has been exceptionally strong, with year-over-year increases running far above the broader sector. Some of that strength reflects favorable metal prices, but it also points to stronger production and better mine-level performance than in earlier periods. For a miner, that is important because revenue gains driven only by prices can reverse quickly, while gains tied to operating consistency tend to be more durable.
Cash generation has also improved sharply. Trailing free cash flow moved into a high range for a company of this size, which gives OceanaGold more flexibility to fund mine development, sustain its dividend framework, and preserve balance-sheet strength without depending heavily on external financing. Among recent catalysts, the company’s stronger earnings profile, expanding cash flow, and continued progress on its operating assets stand out as the clearest drivers of long-term upside.
Another meaningful catalyst is the broader gold price environment. When gold prices stay elevated, a miner with improving operating margins can see profits rise faster than revenue because many mine costs do not increase at the same pace. OceanaGold’s recent margin profile suggests it has been benefiting from exactly that dynamic.
Risks
This article is for informational purposes only and does not constitute financial advice. Some content is AI-generated. See Disclaimer


