Stock Analysis · OC Oerlikon Corporation AG Pfaeffikon (OERLY)
Overview
OC Oerlikon Corporation AG Pfaeffikon is a Swiss industrial technology company focused on surface solutions and advanced materials processing. In simple terms, it helps other manufacturers make parts last longer, perform better, and operate more efficiently. Its technologies are used to coat tools and components, improve wear resistance, manage heat and friction, and support high-performance manufacturing in industries such as automotive, aerospace, energy, electronics, and general industry.
After the sale of its manmade fibers business, Oerlikon has become a more focused company centered on surface technologies. That makes the business easier to understand than it was a few years ago: it now primarily earns money by providing coating services, coating equipment, materials, and related technology solutions for industrial customers.
The main revenue sources are now concentrated in one industrial platform, with a mix of recurring service activity and equipment exposure.
- Surface Solutions / coatings and materials: the large majority of revenue, roughly close to 100% after the portfolio reshaping. This includes tool and component coatings, thermal spray technologies, materials for protective coatings, and services used to extend component life and improve manufacturing performance.
- Service and aftermarket activity: an important share within the core business, although a precise group-wide percentage is not consistently disclosed in a simple form. This usually includes recoating, maintenance, consumables, and customer support, which can be steadier than new equipment demand.
- Equipment and systems: a smaller but still meaningful portion within the remaining business. This includes machinery and systems used to apply or support industrial coating processes.
One visible change in the company’s financial profile is that revenue has become smaller in absolute terms after the divestment, but also more specialized. The business mix is now more concentrated in industrial end markets where performance coatings are tied to efficiency, durability, and increasingly to lightweighting and energy transition applications.
The long-term trend shown here points to a business that has gone through a major reshaping rather than a simple cyclical dip. Revenue is well below earlier levels because the company is now narrower in scope, while profitability has also been uneven. Gross profit has remained meaningful, but operating income and net income have become much thinner, showing that the focused portfolio still needs stronger margin execution.
Key Figures
| Metric | Value | Sector ⓘ |
|---|---|---|
| Date | Oct 17, 2026 | |
| Context | ||
| Sector | Industrials | |
| Industry | Specialty Industrial Machinery | |
| Market Cap ⓘ | $2.28B | |
| Beta ⓘ | 0.99 | |
Value (Cheapness) | ||
| P/E Ratio ⓘ | 59.35 | 22.10 |
| P/B Ratio ⓘ | 3.79 | 1.97 |
| FCF Yield ⓘ | N/A | 6.38% |
| Dividend Yield ⓘ | 15.54% | 1.94% |
| EBIT / EV ⓘ | 4.08% | 4.79% |
| PEG ⓘ | 0.37 | |
Growth (Business expansion) | ||
| Revenue Growth ⓘ | 0.50% | 9.30% |
| RPS Growth (5Y CAGR) ⓘ | -12.27% | 7.81% |
| EPS Growth (5Y CAGR) ⓘ | N/A | -13.06% |
| BVPS Growth (5Y CAGR) ⓘ | -11.22% | 6.14% |
| Margin Growth (5Y Trend) ⓘ | -6.42% | 0.88% |
| FCF Growth (5Y CAGR) ⓘ | -14.32% | 11.01% |
| DPS Growth (5Y CAGR) ⓘ | -13.09% | 9.48% |
Quality (Business durability) | ||
| ROIC (Latest) ⓘ | N/A | 10.84% |
| ROA (Latest) ⓘ | N/A | 5.41% |
| ROIC (5Y Median) ⓘ | 3.64% | 9.38% |
| ROA (5Y Median) ⓘ | 1.63% | 4.95% |
| Net Debt / EBIT (Latest) ⓘ | N/A | 2.08 |
| Net Debt / EBIT (5Y Median) ⓘ | 8.04 | 2.27 |
| Net Debt / EBITDA (Latest) ⓘ | N/A | 1.39 |
| Net Debt / Assets ⓘ | 19.40% | 19.28% |
| EBITDA / Interest ⓘ | N/A | 9.58 |
| Operating Margin (Latest) ⓘ | N/A | 10.50% |
| Operating Margin (5Y Median) ⓘ | 4.92% | 10.29% |
| Debt to Equity (Latest) ⓘ | N/A | 65.48% |
| Profit Margin (Latest) ⓘ | 21.44% | 6.67% |
| Free Cash Flow (Latest) ⓘ | N/A | |
Momentum (Price trend) | ||
| 3Y Return ⓘ | +119.66% | +61.68% |
| 12M Return (excl. last month) ⓘ | +123.95% | +12.58% |
| 6M Return ⓘ | +76.41% | 0.00% |
| Price vs. 200-Day MA ⓘ | +42.43% | +0.02% |
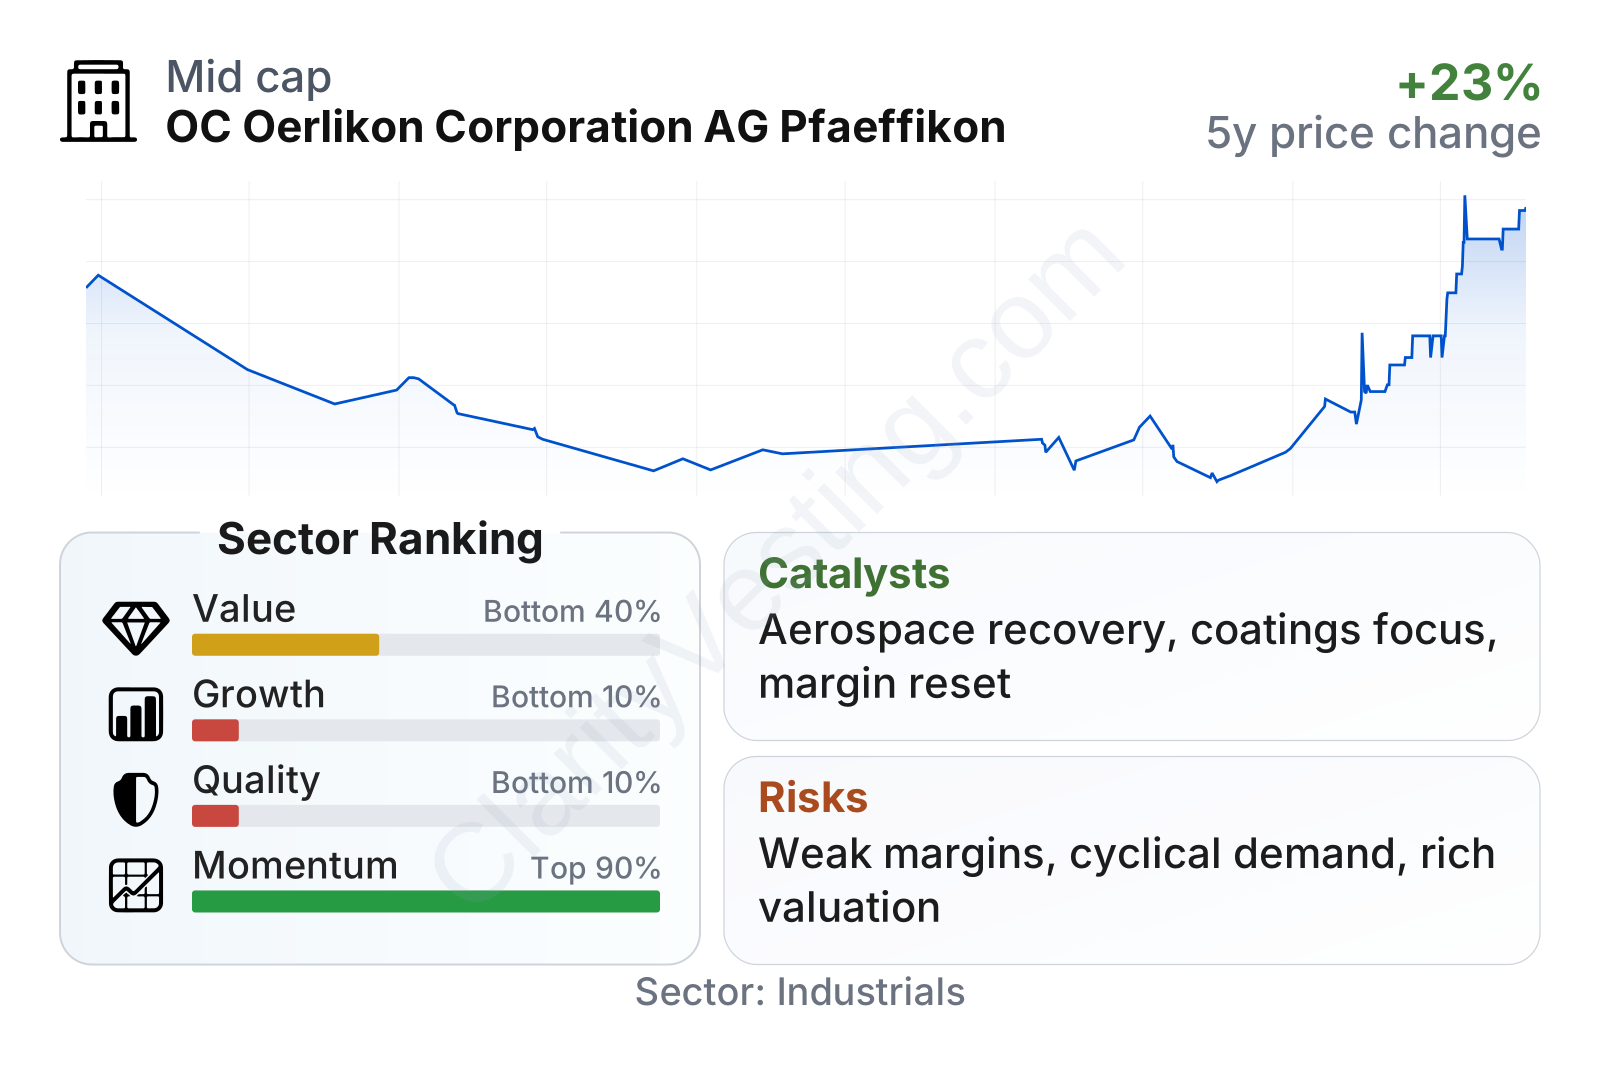
Oerlikon is a mid-sized industrial company with stock volatility close to the broader market. The share price has shown strong momentum over the last 6 to 36 months, outperforming much of the industrial sector over those periods. That market strength stands in contrast with weaker business-quality and growth indicators.
Valuation metrics look demanding on earnings and book value, with the P/E and P/B ratios above sector medians. At the same time, the dividend yield is unusually high, around 16% on a trailing basis, which stands far above the sector norm. That kind of yield often deserves extra caution because it can reflect special distributions, a temporarily depressed price base, or earnings that do not fully support the payout over time.
The weakest area is growth. Recent revenue growth is almost flat at roughly 1%, far below the sector median, while five-year trends for revenue per share, book value per share, free cash flow, and dividends are all negative. Quality indicators are also soft versus peers: historical returns on assets and invested capital are low, operating margins have trended below the sector median, and leverage has been less comfortable when measured against operating profit.
Growth
Oerlikon operates in parts of the industrial economy that have credible long-term demand drivers. Advanced coatings and surface technologies benefit from trends such as fuel efficiency, longer equipment life, lower maintenance costs, more demanding aerospace standards, electrification, additive manufacturing, and the need to reduce material waste. These are not short-lived themes. Manufacturers increasingly want components that can run hotter, last longer, and perform under more extreme conditions, and that directly supports the relevance of Oerlikon’s expertise.
The company’s strategy also makes industrial sense. By exiting the manmade fibers unit, management simplified the portfolio and concentrated resources on a business with higher technical barriers and potentially better recurring service characteristics. A focused surface solutions company can be easier to manage, easier to benchmark, and more strategically coherent than a mixed industrial structure with unrelated activities.
There are also potential catalysts in the current setup. Oerlikon’s technologies are exposed to aerospace recovery, efficiency upgrades in manufacturing, and specialized applications linked to energy and electronics. If industrial production improves and customers restart capital spending, demand for coatings, materials, and related equipment can benefit. In addition, a more focused business may create room for portfolio optimization, cost discipline, and margin rebuilding over time.
A more recent positive signal is that the market appears to be anticipating improvement before it is fully visible in the operating numbers. The sharp share-price recovery from 2026 lows suggests expectations of stabilization, restructuring benefits, or improving order prospects. That does not prove a business turnaround, but it shows that the market is assigning value to future normalization rather than current weakness alone.
Risks
This article is for informational purposes only and does not constitute financial advice. Some content is AI-generated. See Disclaimer


