Stock Analysis · Odyssey Therapeutics Inc (ODTX)
Overview
Odyssey Therapeutics is a clinical-stage biotechnology company developing medicines designed to control immune and inflammatory pathways with greater precision. Its programs are aimed mainly at autoimmune and inflammatory diseases, where existing treatments often work broadly across the immune system and can create safety or tolerability trade-offs. The company’s research platform combines chemistry, protein science, and drug discovery tools to build small-molecule and other targeted therapies for well-defined biological mechanisms.
At this stage, Odyssey is not a commercial pharmaceutical business. It is primarily a research-and-development company, which means its economics are driven much more by scientific progress and financing capacity than by product sales. Revenue has been limited and irregular, reflecting collaboration or other non-product sources rather than a marketed medicine.
The company’s revenue mix is currently very simple:
- Collaboration, license, and other research-related revenue: approximately 100% of total revenue in recent periods. This appears to include payments tied to partnerships or research arrangements rather than recurring product demand.
- Product revenue: 0%. Odyssey does not currently market an approved drug.
That structure is important for long-term analysis: the investment case depends mainly on whether the pipeline can advance into clinically meaningful and commercially valuable assets over time, not on near-term operating sales.
The operating profile shows a classic development-stage biotech pattern. Revenue has remained very small, while research spending has consistently been the largest use of cash and has risen over time. Administrative costs have also increased, but research and development clearly remains the dominant expense line, underlining that Odyssey is still funding discovery and clinical progress rather than harvesting earnings from an established franchise.
Key Figures
| Metric | Value | Sector ⓘ |
|---|---|---|
| Date | Oct 17, 2026 | |
| Context | ||
| Sector | Healthcare | |
| Industry | Biotechnology | |
| Market Cap ⓘ | $981.36M | |
| Beta ⓘ | N/A | |
Value (Cheapness) | ||
| P/E Ratio ⓘ | N/A | 24.79 |
| P/B Ratio ⓘ | 1.47 | 3.08 |
| FCF Yield ⓘ | -15.26% | 3.15% |
| Dividend Yield ⓘ | N/A | 1.94% |
| EBIT / EV ⓘ | -23.94% | 0.57% |
| PEG ⓘ | N/A | |
Growth (Business expansion) | ||
| Revenue Growth ⓘ | N/A | 7.45% |
| RPS Growth (5Y CAGR) ⓘ | N/A | 8.61% |
| EPS Growth (5Y CAGR) ⓘ | N/A | -17.81% |
| BVPS Growth (5Y CAGR) ⓘ | N/A | 3.72% |
| Margin Growth (5Y Trend) ⓘ | N/A | -0.62% |
| FCF Growth (5Y CAGR) ⓘ | N/A | 1.04% |
| DPS Growth (5Y CAGR) ⓘ | N/A | 6.77% |
Quality (Business durability) | ||
| ROIC (Latest) ⓘ | N/A | 3.24% |
| ROA (Latest) ⓘ | N/A | 3.01% |
| ROIC (5Y Median) ⓘ | N/A | 4.60% |
| ROA (5Y Median) ⓘ | -53.44% | 1.89% |
| Net Debt / EBIT (Latest) ⓘ | N/A | 1.34 |
| Net Debt / EBIT (5Y Median) ⓘ | N/A | 1.84 |
| Net Debt / EBITDA (Latest) ⓘ | N/A | 1.00 |
| Net Debt / Assets ⓘ | -11.82% | 5.45% |
| EBITDA / Interest ⓘ | N/A | 9.64 |
| Operating Margin (Latest) ⓘ | -5924.96% | 9.27% |
| Operating Margin (5Y Median) ⓘ | -5025.44% | 7.38% |
| Debt to Equity (Latest) ⓘ | 5.89% | 28.58% |
| Profit Margin (Latest) ⓘ | N/A | 3.59% |
| Free Cash Flow (Latest) ⓘ | -$149.72M | |
Momentum (Price trend) | ||
| 3Y Return ⓘ | N/A | +42.80% |
| 12M Return (excl. last month) ⓘ | N/A | +18.50% |
| 6M Return ⓘ | N/A | +7.57% |
| Price vs. 200-Day MA ⓘ | N/A | +5.12% |
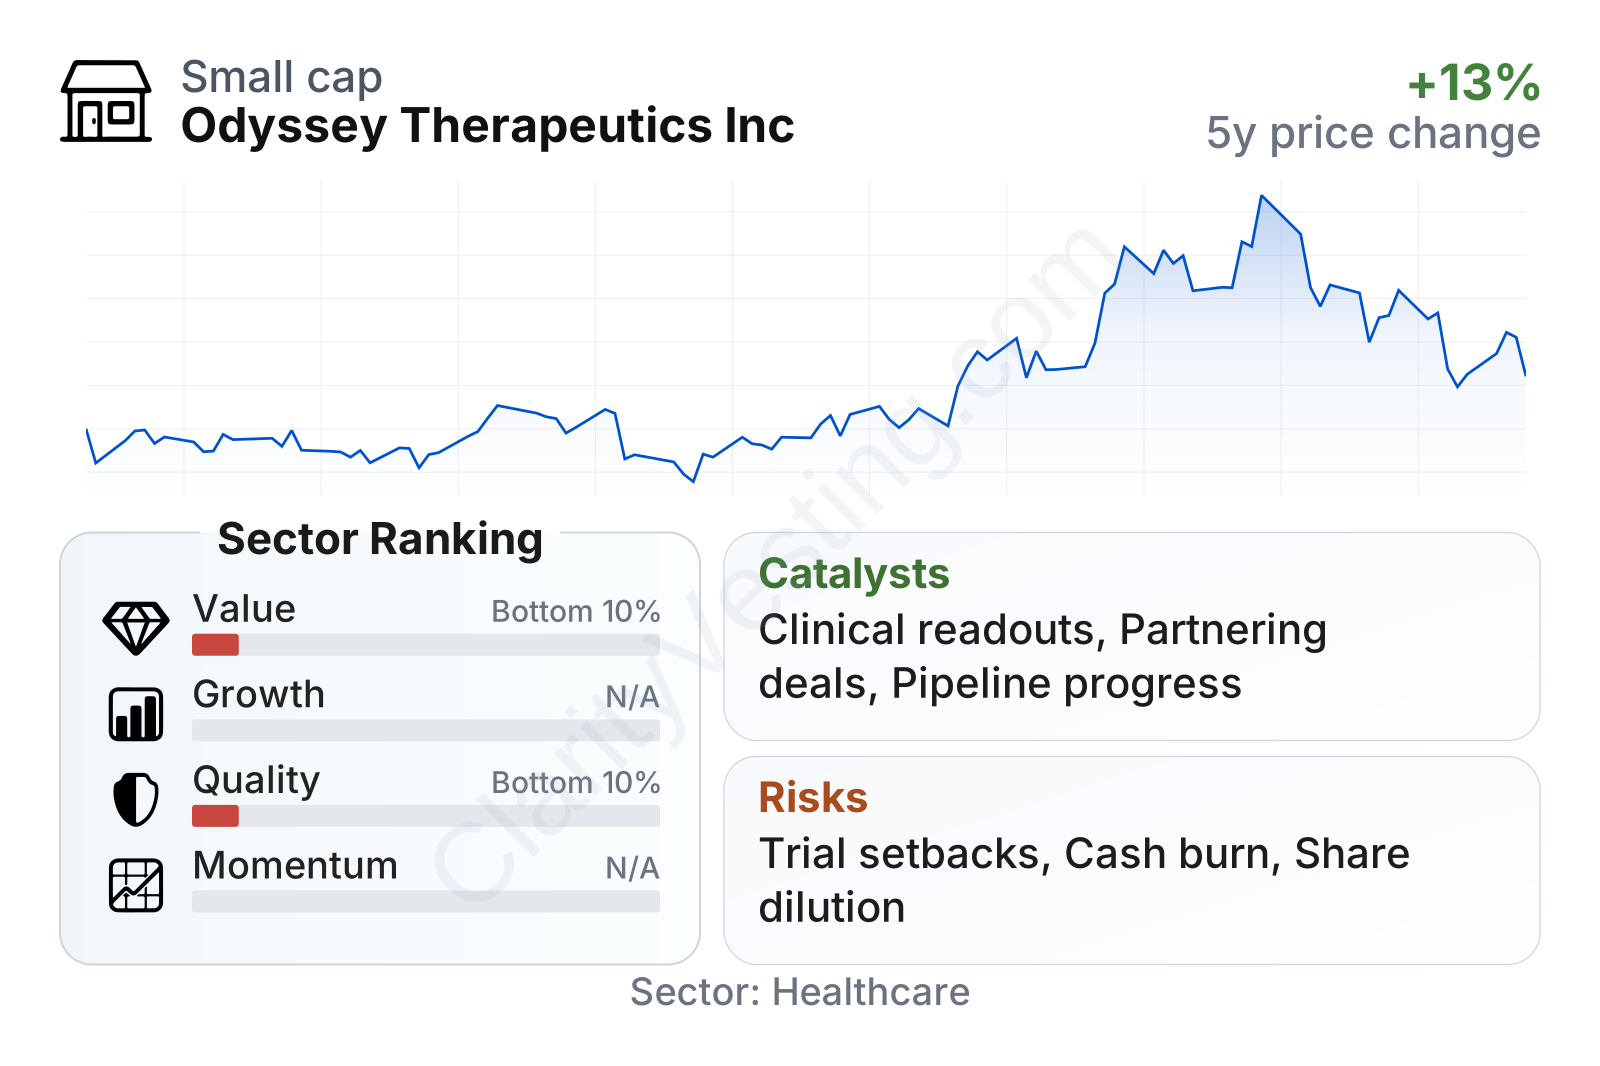
The table points to a business that is financially clean from a balance-sheet perspective but still deeply unprofitable, which is typical for an early-stage biotech. Debt is low relative to equity, and net debt appears favorable because cash outweighs borrowings. However, profitability and cash generation metrics sit near the bottom of the healthcare sector, reflecting heavy research spending, no commercial product base, and negative free cash flow of roughly $150 million over the last twelve months.
On valuation measures, the stock looks inexpensive on book value compared with the sector median, but that should be interpreted carefully. For a pre-revenue biotech, traditional earnings-based ratios are not very useful because current losses are expected. In this context, market value tends to reflect pipeline expectations, scientific credibility, cash runway, and the probability of future licensing or drug approvals rather than present-day profits.
The share price has also moved up meaningfully between early May and early August 2026, suggesting improving market expectations. For a company at this stage, price movements often follow pipeline updates, regulatory milestones, or capital market developments more than reported revenue trends.
Growth
Odyssey operates in one of the most active areas of biotechnology: targeted treatments for autoimmune and inflammatory disease. This is a large and growing therapeutic market because these illnesses are common, often chronic, and still leave room for better efficacy, convenience, and safety. Drug developers are increasingly trying to move beyond older broad immunosuppressive approaches toward more selective mechanisms, which fits Odyssey’s stated strategy.
The company’s growth logic is straightforward. Rather than relying on one broad platform claim alone, Odyssey has been building a pipeline around specific biological targets that could matter across multiple immune-mediated diseases. If any lead program generates convincing clinical data, the upside can extend beyond a single indication because the same mechanism may apply to several disorders. That creates optionality, which is one of the main attractions in development-stage biotech.
A second potential growth driver is business development. Smaller biotech companies often create value not only through eventual commercialization, but also through partnerships with larger pharmaceutical groups that want access to differentiated science. Because Odyssey currently has minimal revenue, a meaningful licensing deal, collaboration payment, or co-development agreement could alter its financial profile much faster than incremental operating progress alone.
Recent corporate updates from the company have centered on pipeline advancement and continued investment in its research engine. For long-term analysis, the most important catalysts are likely to be clinical readouts, regulatory progress into later-stage studies, and any external validation from partners. Those events matter more here than quarter-to-quarter revenue because they directly affect the probability that Odyssey’s assets become commercially relevant.
Risks
This article is for informational purposes only and does not constitute financial advice. Some content is AI-generated. See Disclaimer


