Stock Analysis · Old Mutual Limited (ODMUF)
Overview
Old Mutual Limited is a South Africa-based financial services group focused on savings, insurance, lending, and wealth management. Its business is centered on helping individuals and corporate clients protect income, invest for retirement, manage day-to-day finances, and access credit. The group mainly operates in South Africa, with additional exposure to other African markets, and it combines life insurance, asset management, banking-related activities, and advisory services under one brand.
Its revenue mix can move meaningfully from year to year because insurers and asset managers report not only fees and premiums, but also investment returns and market-related movements. That makes exact percentages less stable than in a typical industrial company. Based on the group’s segment structure in recent annual reporting, the main economic engines can be summarized as follows:
- Personal Finance – the largest contributor, roughly 35% to 45% of group earnings in a normal year. This includes life insurance, recurring-premium savings products, retirement solutions, and protection products sold to mass and middle-income customers.
- Wealth Management – about 20% to 30%. This covers asset management, advisory, platform administration, and investment products for retail, affluent, and institutional clients.
- Old Mutual Investments / asset management activities – around 10% to 20%. These operations generate fees linked to assets under management and can benefit when markets rise and net inflows improve.
- Old Mutual Finance – approximately 10% to 15%. This segment provides unsecured lending, transactional banking-related offerings, and savings products, mainly in South Africa.
- Corporate and specialty insurance activities – usually less than 10% individually. These include employee benefits, commercial risk solutions, and other group-level activities.
The broad shape of the business is important for long-term analysis: Old Mutual is not a single-product insurer, but a diversified financial group whose results depend on consumer savings, underwriting discipline, lending quality, and capital market conditions. Over the last several years, profitability has generally recovered even though reported revenue has been more volatile, which is common for companies with large investment-linked operations.
The long-term pattern shows a business with large swings in reported revenue but a steadier improvement in operating income and net income. That suggests underlying earnings quality depends less on headline revenue and more on margins, claims experience, fee generation, and capital management.
Key Figures
| Metric | Value | Sector ⓘ |
|---|---|---|
| Date | Oct 24, 2026 | |
| Context | ||
| Sector | Financial Services | |
| Industry | Financial Conglomerates | |
| Market Cap ⓘ | $3.15B | |
| Beta ⓘ | 0.61 | |
Value (Cheapness) | ||
| P/E Ratio ⓘ | 9.74 | 12.46 |
| P/B Ratio ⓘ | 0.00 | 1.25 |
| FCF Yield ⓘ | 1139.57% | 9.82% |
| Dividend Yield ⓘ | 6.46% | 2.94% |
| EBIT / EV ⓘ | N/A | 8.11% |
| PEG ⓘ | N/A | |
Growth (Business expansion) | ||
| Revenue Growth ⓘ | -6.50% | 9.10% |
| RPS Growth (5Y CAGR) ⓘ | 108.43% | 12.31% |
| EPS Growth (5Y CAGR) ⓘ | N/A | -6.97% |
| BVPS Growth (5Y CAGR) ⓘ | 98.01% | 5.02% |
| Margin Growth (5Y Trend) ⓘ | 2.68% | -4.00% |
| FCF Growth (5Y CAGR) ⓘ | N/A | 4.71% |
| DPS Growth (5Y CAGR) ⓘ | 120.46% | 8.92% |
Quality (Business durability) | ||
| ROIC (Latest) ⓘ | N/A | 9.18% |
| ROE (Latest) ⓘ | 25.90% | 13.93% |
| ROA (Latest) ⓘ | 1.13% | 1.57% |
| ROIC (5Y Median) ⓘ | 10.08% | 7.80% |
| ROE (5Y Median) ⓘ | 13.02% | 12.15% |
| ROA (5Y Median) ⓘ | 0.64% | 1.28% |
| Net Debt / EBIT (Latest) ⓘ | N/A | 1.02 |
| Net Debt / EBIT (5Y Median) ⓘ | -0.46 | 0.72 |
| Net Debt / EBITDA (Latest) ⓘ | -1.33 | 0.88 |
| Operating Margin (Latest) ⓘ | N/A | 22.30% |
| Operating Margin (5Y Median) ⓘ | 9.60% | 24.50% |
| Debt to Equity (Latest) ⓘ | 4.43% | 59.34% |
| Profit Margin (Latest) ⓘ | 7.16% | 26.42% |
| Free Cash Flow (Latest) ⓘ | $35.89B | |
Momentum (Price trend) | ||
| 3Y Return ⓘ | +79.53% | +95.73% |
| 12M Return (excl. last month) ⓘ | +45.53% | +17.30% |
| 6M Return ⓘ | +7.90% | +6.07% |
| Price vs. 200-Day MA ⓘ | +10.40% | +5.36% |
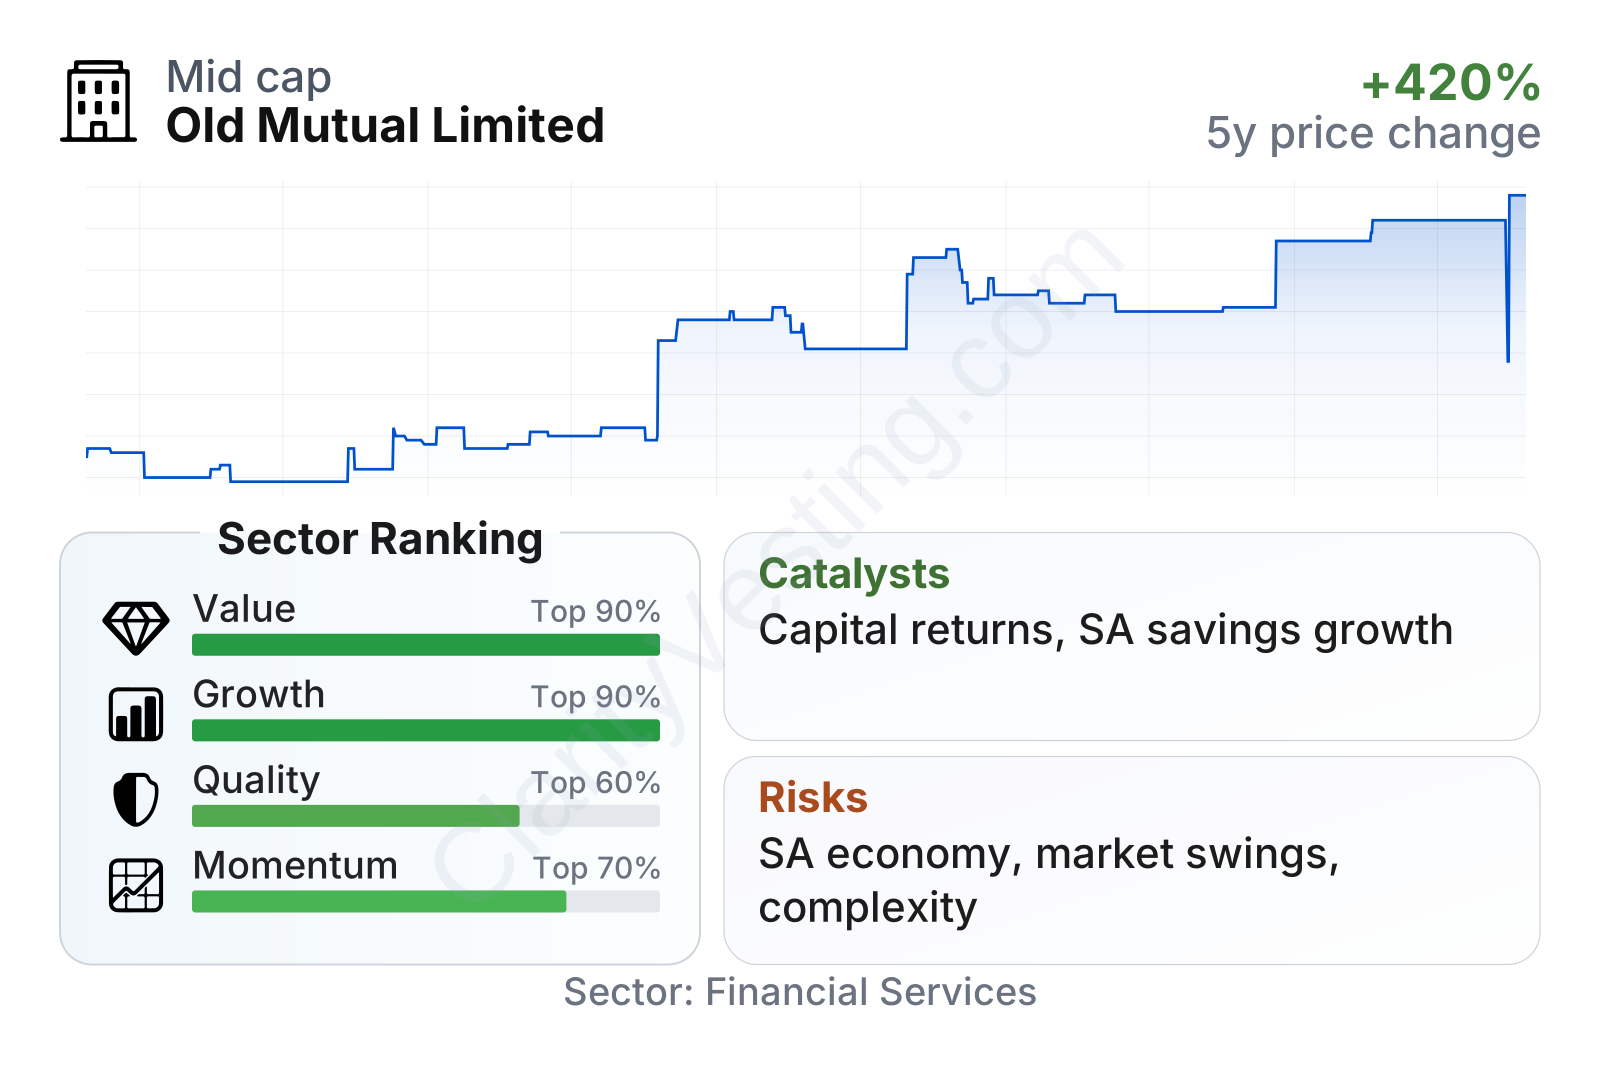
Old Mutual stands out as a mid-sized financial group with a relatively low share-price volatility profile, reflected in a beta well below 1. On valuation measures, it screens as very inexpensive versus the broader financial sector, with a single-digit earnings multiple, a high free cash flow yield, and a dividend yield above the sector median. Profitability is mixed: return on equity is strong at roughly 26%, but profit margin and return on assets are less impressive than the sector median. The balance sheet looks conservative in several respects, with debt-to-equity near 4% and net debt metrics indicating a net cash position rather than heavy leverage. Growth indicators are unusual but clearly strong over a five-year view, especially in revenue per share, book value per share, and dividends per share, although the latest year-over-year revenue comparison is negative and shows that results can be uneven.
The stock chart shows a very sharp rerating since late 2023, followed by a more stable trading range and another push higher in 2026. That pattern fits a company whose market perception improved faster than its reputation had previously allowed, but where the share price still remains low relative to reported book value and earnings.
Growth
Old Mutual operates in sectors that should remain structurally relevant for years: life insurance, retirement savings, wealth management, and credit access. In South Africa and many other African markets, long-term demand is supported by under-penetration in formal savings and insurance products, a growing need for retirement funding, and increasing demand for financial advice. Those trends do not guarantee fast expansion every year, but they do create a durable backdrop for companies with trusted distribution and broad product ranges.
The company’s strategy also makes industrial sense. It serves customers across multiple financial needs rather than relying on one product line. That can deepen client relationships and lower distribution costs over time. If a customer saves, borrows, insures income, and invests through the same ecosystem, the business can potentially earn more lifetime value from each relationship. This is especially relevant in markets where distribution reach and brand recognition matter as much as product design.
Even without a long public series here, the broader earnings trend appears constructive. Five-year metrics point to strong expansion in earnings power, and the latest net income level remains above earlier periods despite revenue volatility. That matters because insurers and wealth managers are judged more by sustainable earnings, capital strength, and cash generation than by simple top-line consistency.
Book value per share is particularly important for a financial company, and Old Mutual’s long-term progression points to a step-up in underlying equity value, even though the path was not smooth. Combined with strong dividend growth over five years, this suggests that recent years were not driven only by accounting noise; there has also been real strengthening in shareholder value per share.
A meaningful catalyst is the company’s ability to turn cash generation into capital returns while still supporting operations. Free cash flow is strong, leverage is modest, and the dividend yield remains elevated. In a financial company, that combination can attract attention when earnings remain resilient. Another catalyst is any improvement in consumer confidence, savings flows, and market levels in South Africa, since these can support both fee income and insurance sales. If management continues improving mix, efficiency, and capital discipline, the group has room for further normalization in valuation compared with peers.
Recent business momentum also appears favorable in market terms. The stock has materially outperformed the sector over three years and over the prior 12-month period excluding the latest month, which often signals that the market has recognized improving fundamentals. That does not remove risk, but it suggests Old Mutual is no longer being treated purely as a troubled or stagnant financial name.
Risks
This article is for informational purposes only and does not constitute financial advice. Some content is AI-generated. See Disclaimer


