Stock Analysis · OceanFirst Financial Corp (OCFC)
Overview
OceanFirst Financial Corp is a regional banking company headquartered in New Jersey. Through OceanFirst Bank, it provides traditional banking services to consumers, businesses, and local communities, with a footprint centered on New Jersey and parts of the broader Northeast. Its business is fairly easy to understand: it gathers deposits from customers, lends money at higher rates than it pays on those deposits, and also earns fees from related financial services.
For a bank like OceanFirst, revenue does not come from selling products in the same way as an industrial company. The main economic drivers are spread income and fee income. Based on recent annual reporting, the revenue mix is approximately structured as follows:
- Net interest income: about 75% to 85% of total revenue. This is the core of the business and reflects interest earned on commercial loans, residential mortgages, consumer loans, and securities, minus interest paid on deposits and borrowings.
- Non-interest income: about 15% to 25% of total revenue. This includes bank fees, trust and asset management income, bank-owned life insurance income, swap fee income, and gains or losses tied to securities or other balance-sheet activities.
Inside lending, OceanFirst has meaningful exposure to commercial real estate, multifamily, commercial and industrial lending, and residential mortgages. On the funding side, customer deposits are the key source of financing, supplemented by wholesale borrowings when needed. That means the company’s results are heavily influenced by interest rates, deposit competition, and credit quality rather than by rapid unit sales growth.
OceanFirst is not a national banking giant. It is a smaller regional player, which can be a strength in relationship banking and local market knowledge, but it also limits scale compared with larger peers. Over the last several years, total revenue expanded, yet profitability did not keep pace because funding costs rose sharply and compressed earnings.
The long-term pattern shows a bank that lifted revenue meaningfully from 2021 through 2024, but with net income moving in the opposite direction more recently. The key pressure point has been the rising cost of funding and interest expense, which has reduced the share of revenue flowing through to profits.
Key Figures
| Metric | Value | Sector ⓘ |
|---|---|---|
| Date | Oct 17, 2026 | |
| Context | ||
| Sector | Financial Services | |
| Industry | Banks - Regional | |
| Market Cap ⓘ | $1.52B | |
| Beta ⓘ | 1.00 | |
Value (Cheapness) | ||
| P/E Ratio ⓘ | 19.69 | 12.26 |
| P/B Ratio ⓘ | 0.46 | 1.23 |
| FCF Yield ⓘ | 7.40% | 10.40% |
| Dividend Yield ⓘ | 4.99% | 3.02% |
| EBIT / EV ⓘ | 1.76% | 8.14% |
| PEG ⓘ | 1.15 | |
Growth (Business expansion) | ||
| Revenue Growth ⓘ | 32.20% | 9.35% |
| RPS Growth (5Y CAGR) ⓘ | 15.04% | 12.19% |
| EPS Growth (5Y CAGR) ⓘ | -23.52% | -9.53% |
| BVPS Growth (5Y CAGR) ⓘ | -37.76% | 4.99% |
| Margin Growth (5Y Trend) ⓘ | -22.47% | -3.86% |
| FCF Growth (5Y CAGR) ⓘ | -9.39% | 4.81% |
| DPS Growth (5Y CAGR) ⓘ | 3.01% | 8.79% |
Quality (Business durability) | ||
| ROIC (Latest) ⓘ | 1.35% | 9.49% |
| ROE (Latest) ⓘ | 2.36% | 13.90% |
| ROA (Latest) ⓘ | 0.25% | 1.55% |
| ROIC (5Y Median) ⓘ | 3.70% | 7.86% |
| ROE (5Y Median) ⓘ | 4.22% | 12.17% |
| ROA (5Y Median) ⓘ | 0.78% | 1.30% |
| Net Debt / EBIT (Latest) ⓘ | 31.50 | 0.96 |
| Net Debt / EBIT (5Y Median) ⓘ | 6.54 | 0.73 |
| Net Debt / EBITDA (Latest) ⓘ | 24.89 | 0.92 |
| Operating Margin (Latest) ⓘ | 9.04% | 22.30% |
| Operating Margin (5Y Median) ⓘ | 21.47% | 24.63% |
| Debt to Equity (Latest) ⓘ | 94.85% | 58.56% |
| Profit Margin (Latest) ⓘ | 11.20% | 26.57% |
| Free Cash Flow (Latest) ⓘ | $112.68M | |
Momentum (Price trend) | ||
| 3Y Return ⓘ | +31.35% | +88.33% |
| 12M Return (excl. last month) ⓘ | +8.50% | +19.38% |
| 6M Return ⓘ | -14.54% | +4.75% |
| Price vs. 200-Day MA ⓘ | -12.74% | +3.50% |
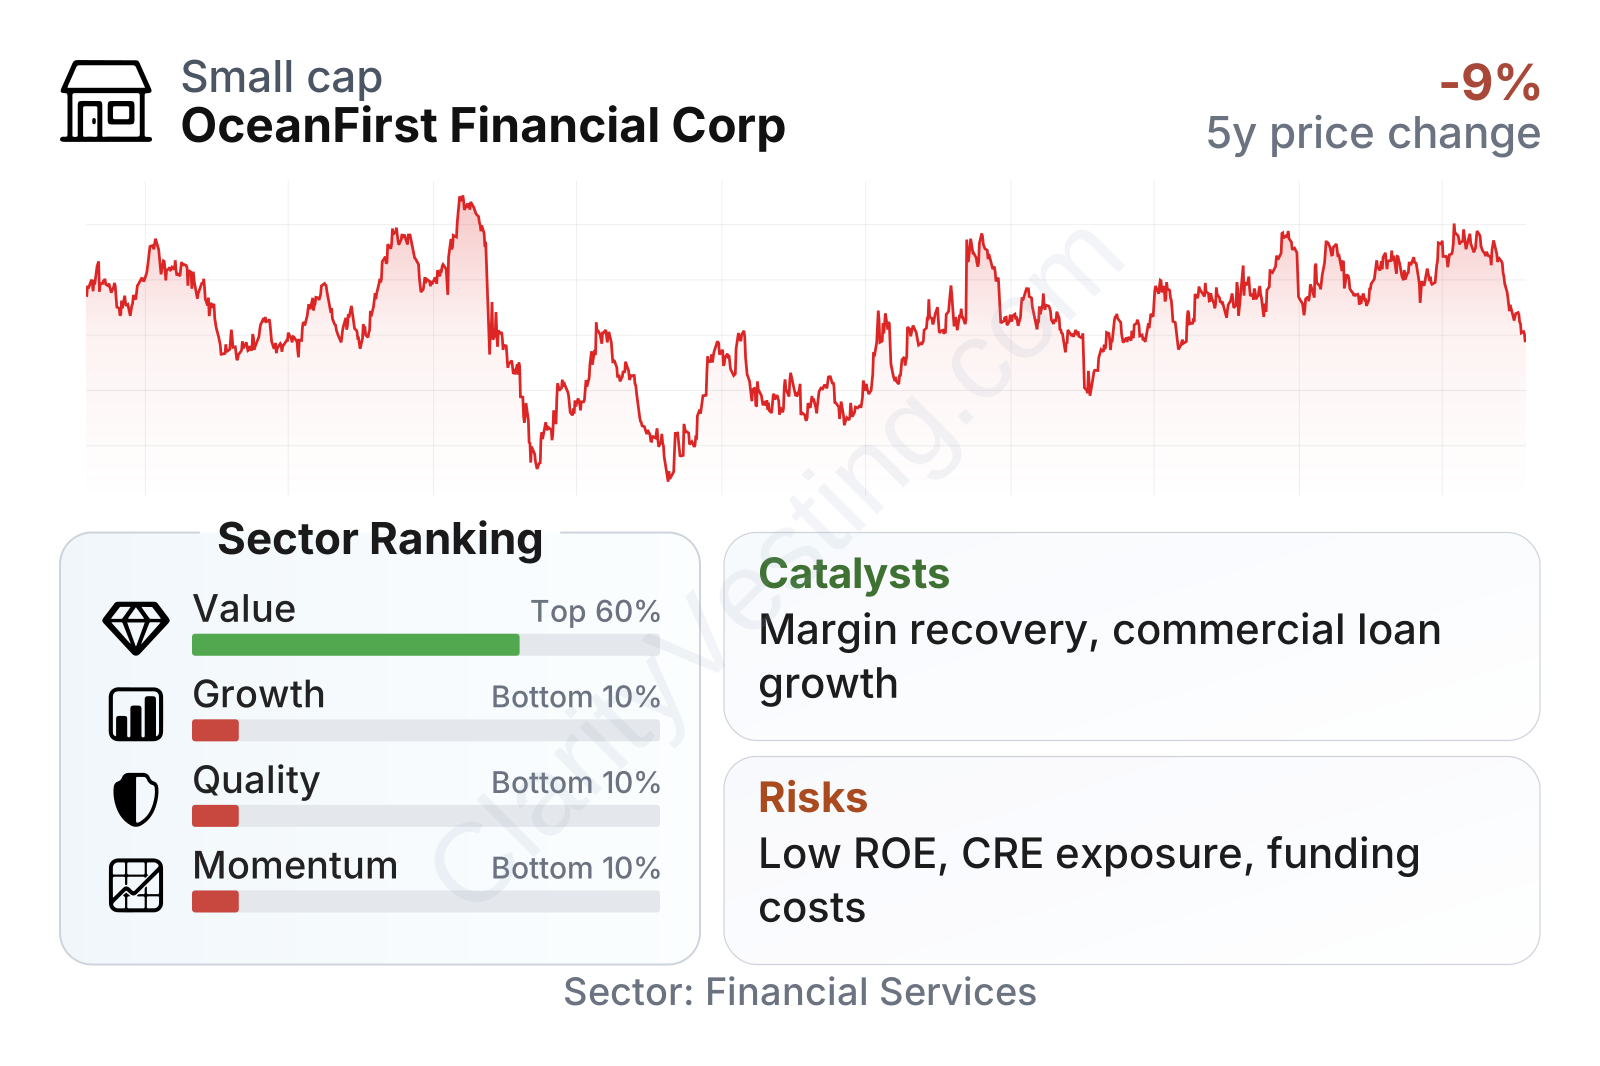
OceanFirst sits in the small-cap range, with share-price volatility close to the broader market rather than extreme. The overall profile is mixed: valuation metrics look inexpensive on book value and income yield, but growth, profitability, and momentum rank weakly versus regional bank peers. Revenue has held up better than many competitors, yet returns on equity and assets are currently well below sector norms, which helps explain why the market is assigning a discounted multiple.
The stock-price path over the last few years reflects that tension. Shares fell sharply during the regional bank stress period and later recovered part of that decline, but performance still trails much of the sector over longer stretches. The dividend yield remains above the sector median, which signals income support, although that alone does not offset weaker operating returns.
Growth
Regional banking is a mature sector, so long-term growth usually comes from gaining deposits, expanding commercial lending, acquiring smaller institutions, deepening fee-based services, and improving net interest margin rather than from disruptive market expansion. In that sense, OceanFirst operates in a sector that remains essential, but not structurally high-growth.
The company’s strategy appears logical for a regional bank: focus on community and commercial banking in attractive Northeast markets, keep building commercial relationships, and use fee-generating services such as trust, asset management, and treasury-related offerings to diversify away from pure spread income. If rate conditions become more stable and deposit costs ease, that strategy can support steadier earnings recovery.
One encouraging point is that top-line growth has been better than the sector median in recent comparisons, and five-year revenue per share growth has also been ahead of many peers. That suggests the franchise has retained business volume and customer relationships even during a difficult interest-rate cycle.
However, earnings per share peaked in 2022 and then moved lower through 2025, showing that revenue growth alone has not translated into better shareholder economics. For long-term analysis, this matters: a bank can grow assets and revenue, but if funding costs, credit costs, or operating expenses rise too fast, shareholders do not fully benefit.
Book value per share has been more stable in recent years after unusual historical distortion in older points, but the broader five-year trend remains weak compared with the sector. For banks, book value is a particularly important anchor because it reflects the capital base supporting future lending and earnings. A flatter book value trend reduces the argument for strong compounding unless profitability improves.
A realistic catalyst would be a normalization of deposit pricing and a wider spread between loan yields and funding costs. Another potential positive is continued loan growth in commercial categories if credit quality stays contained. Recent company reporting has also emphasized capital management and balance-sheet discipline, which could help earnings recover if the operating environment becomes less punitive.
Risks
This article is for informational purposes only and does not constitute financial advice. Some content is AI-generated. See Disclaimer


