Stock Analysis · NWS Holdings Limited (NWSZF)
Overview
NWS Holdings Limited is a Hong Kong-based infrastructure, construction, and insurance group. Its activities are concentrated in Greater China, with operations that combine engineering and construction services, roads, logistics-related assets, and insurance. For long-term analysis, the key point is that this is not a pure construction company: it mixes project-based activities, which can be cyclical, with businesses that can provide steadier cash generation.
In recent years, the group has become more focused. Public company materials show that its main reporting segments are insurance and roads, while construction remains economically important through its engineering and contracting exposure. This matters because the company’s earnings profile increasingly depends on asset-heavy, cash-generating businesses rather than only on winning new construction contracts.
The latest annual disclosures indicate that revenue is led by construction-related activity, while profit contribution can be more influenced by insurance and roads because those businesses often carry different margins and cash characteristics. Based on recent reporting structure and annual report disclosures, the main sources of revenue can be summarized as follows:
- Construction: approximately 75% to 85% of revenue. This includes engineering, civil works, building construction, and related contracting services, mainly through Hong Kong and mainland China operations.
- Insurance: approximately 10% to 20% of revenue. This is primarily generated through its insurance platform and includes premium-related business.
- Roads and other operations: approximately 5% to 10% of revenue. This includes toll roads and selected infrastructure-related assets and services.
Revenue mix does not tell the full story, because construction usually has high turnover but lower margins than insurance or infrastructure assets. That helps explain why the business can look more profitable than a plain revenue breakdown would suggest. Over the last few years, operating margins have generally remained stronger than the broader industry median even as total revenue moved around.
The broad financial flow also shows a notable pattern: revenue has been fairly stable in the last several years, but profitability improved sharply in the most recent period as gross profit and operating income expanded. At the same time, interest costs have been meaningful, so financing structure remains important when assessing the business.
Key Figures
| Metric | Value | Sector ⓘ |
|---|---|---|
| Date | Oct 03, 2026 | |
| Context | ||
| Sector | Industrials | |
| Industry | Engineering & Construction | |
| Market Cap ⓘ | $4.52B | |
| Beta ⓘ | 0.46 | |
Value (Cheapness) | ||
| P/E Ratio ⓘ | 14.15 | 22.45 |
| P/B Ratio ⓘ | 0.11 | 1.98 |
| FCF Yield ⓘ | 87.09% | 6.31% |
| Dividend Yield ⓘ | 7.85% | 1.96% |
| EBIT / EV ⓘ | 176.97% | 4.81% |
| PEG ⓘ | N/A | |
Growth (Business expansion) | ||
| Revenue Growth ⓘ | 17.20% | 9.10% |
| RPS Growth (5Y CAGR) ⓘ | -7.25% | 7.75% |
| EPS Growth (5Y CAGR) ⓘ | -18.22% | -13.59% |
| BVPS Growth (5Y CAGR) ⓘ | -10.81% | 6.22% |
| Margin Growth (5Y Trend) ⓘ | 13.96% | 0.72% |
| FCF Growth (5Y CAGR) ⓘ | N/A | 10.98% |
| DPS Growth (5Y CAGR) ⓘ | -32.58% | 9.48% |
Quality (Business durability) | ||
| ROIC (Latest) ⓘ | N/A | 10.92% |
| ROA (Latest) ⓘ | 2.80% | 5.41% |
| ROIC (5Y Median) ⓘ | 4.87% | 9.21% |
| ROA (5Y Median) ⓘ | 1.44% | 4.94% |
| Net Debt / EBIT (Latest) ⓘ | 2.02 | 2.07 |
| Net Debt / EBIT (5Y Median) ⓘ | 3.04 | 2.28 |
| Net Debt / EBITDA (Latest) ⓘ | 1.43 | 1.43 |
| Net Debt / Assets ⓘ | 8.75% | 19.27% |
| EBITDA / Interest ⓘ | 2.51 | 9.53 |
| Operating Margin (Latest) ⓘ | 16.15% | 10.50% |
| Operating Margin (5Y Median) ⓘ | 17.64% | 10.27% |
| Debt to Equity (Latest) ⓘ | 94.41% | 65.48% |
| Profit Margin (Latest) ⓘ | 9.49% | 6.62% |
| Free Cash Flow (Latest) ⓘ | $3.94B | |
Momentum (Price trend) | ||
| 3Y Return ⓘ | +164.50% | +58.56% |
| 12M Return (excl. last month) ⓘ | +44.13% | +15.63% |
| 6M Return ⓘ | -0.92% | +4.19% |
| Price vs. 200-Day MA ⓘ | +0.23% | +0.93% |
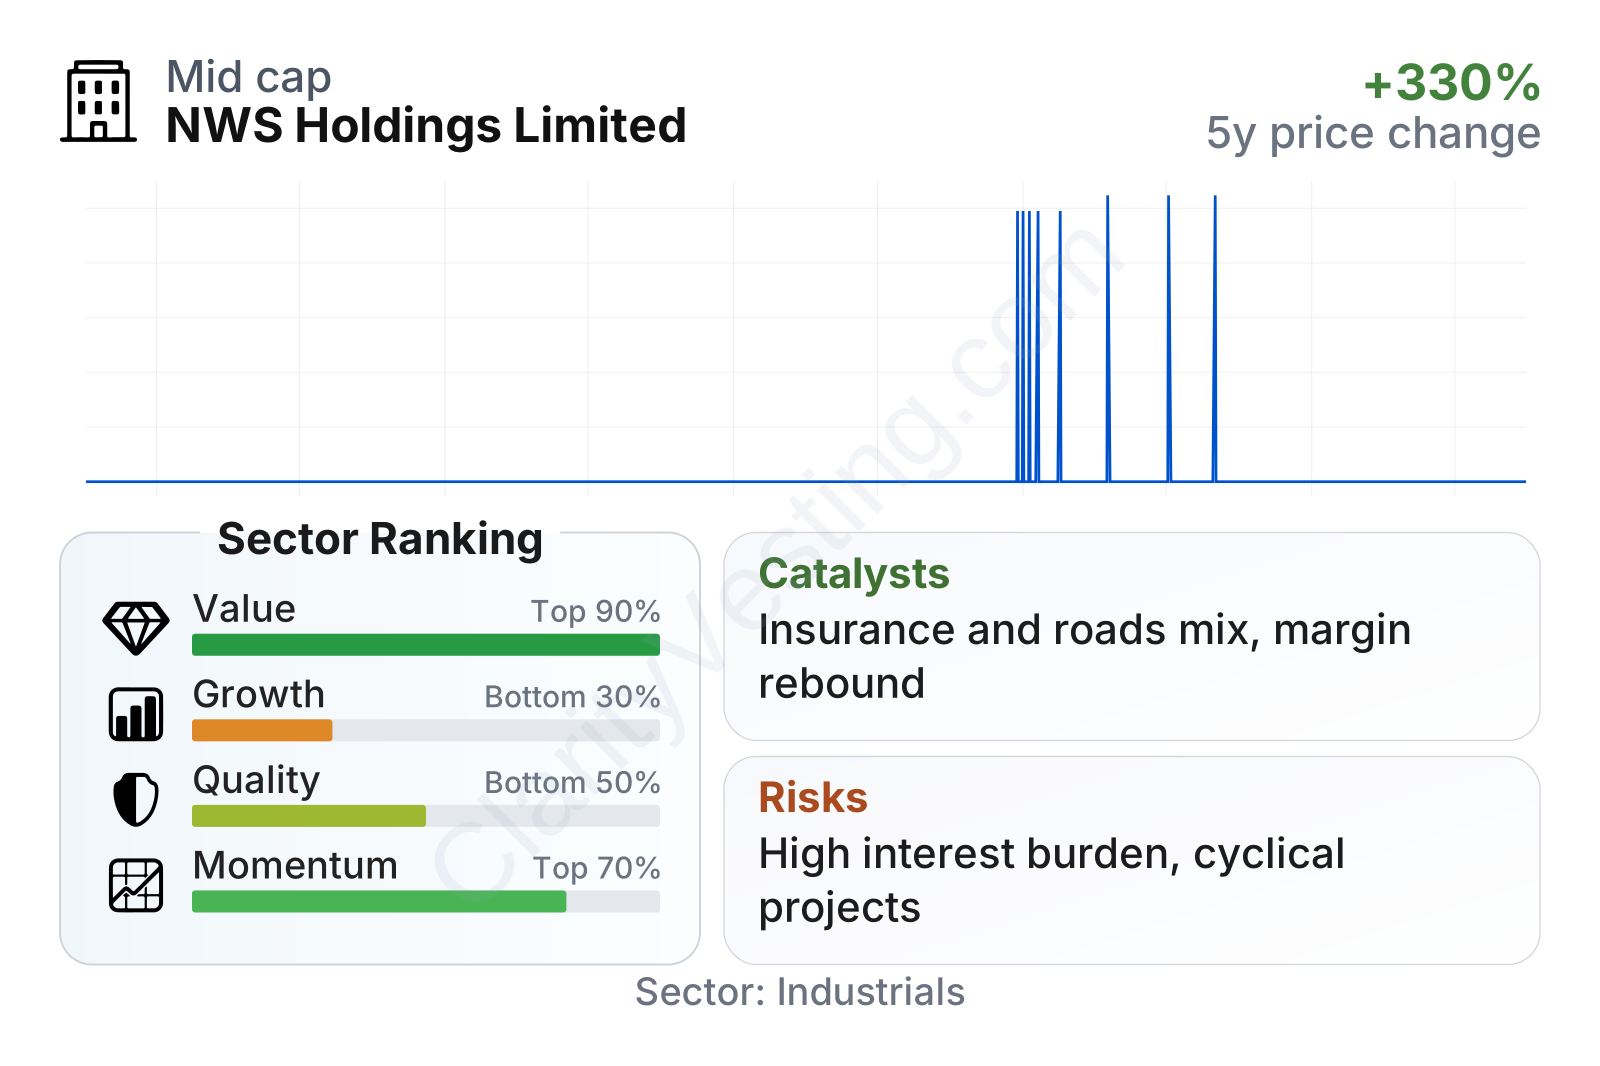
NWS Holdings stands out more on valuation and cash generation than on long-term growth. The stock has delivered a strong multi-year share price recovery, with performance over three years clearly ahead of the sector median, although momentum has flattened more recently. On valuation, the company screens as inexpensive versus the sector on earnings and especially on book value, while the trailing dividend yield is well above the industry norm.
Profitability is mixed. Operating margin and net margin are both stronger than the sector median, which suggests the business mix has some higher-quality earnings components. However, returns on assets and multi-year returns on invested capital are weaker than the industry median, showing that capital efficiency is not a major strength. Balance sheet metrics are also mixed: debt relative to assets is moderate, but debt relative to equity is high and interest coverage is much lower than the sector norm, which keeps leverage under close watch despite healthy free cash flow.
Growth
NWS Holdings operates in sectors that are essential rather than fast-moving. Infrastructure, roads, and engineering benefit from long-term urban development, transport demand, maintenance spending, and public works. Insurance adds a different growth angle, tied to savings, protection products, and cross-border wealth demand in Hong Kong and mainland China. That combination gives the company exposure to structurally relevant markets, but not to the kind of rapid expansion usually seen in technology or high-growth consumer industries.
The company’s strategy makes sense if the goal is steadier long-term economics. Roads and insurance can provide recurring earnings and cash flow, while construction offers scale and market presence. This mix can smooth out some of the volatility that would come from relying only on contracting work. The latest financial pattern supports that idea: year-over-year revenue growth has been solid, margins improved meaningfully, and free cash flow is unusually strong relative to the current market value.
A visible catalyst is the continued shift toward businesses with better margins and more dependable cash generation. If insurance and roads continue to represent a larger share of profit than of revenue, overall earnings quality could improve. Another potential support is Hong Kong and Greater China infrastructure spending, where established local players with execution records can benefit from large and complex projects. The group’s low share-price volatility also suggests the market increasingly sees it as a steadier asset-backed business rather than only as a contractor.
Recent company reporting also points to stronger operating profit in the latest fiscal year, helped by improved gross profit and operating income. That is important because it suggests that the business is not relying only on revenue growth; it is also showing margin resilience. For a long-term view, that is often more meaningful than top-line expansion alone.
Risks
This article is for informational purposes only and does not constitute financial advice. Some content is AI-generated. See Disclaimer


