Stock Analysis · NWS Holdings Ltd (NWSGY)
Overview
NWS Holdings Ltd is a Hong Kong-based infrastructure, construction, insurance, and logistics group. The company has evolved from a more diversified conglomerate into a business centered on roads, construction-related operations, insurance, and logistics assets. For U.S. investors using the ADR ticker NWSGY, the key point is that this is not a pure engineering company despite its sector label. Its earnings mix includes regulated or contracted infrastructure cash flow, project-based construction activity, and financial services exposure through insurance.
Based on the company’s latest annual reporting structure and public disclosures, revenue is mainly generated from the following activities:
- Construction and facilities-related businesses: approximately 50% to 60% of group revenue. This includes construction, engineering, and related project execution, which usually produce large revenue but can be lower-margin and more cyclical than regulated assets.
- Insurance: approximately 20% to 30% of group revenue. This comes mainly from premium income and related insurance operations following the company’s expansion in this segment.
- Logistics: approximately 10% to 20% of group revenue. This includes warehousing, supply-chain, and freight-related services.
- Roads and other infrastructure: generally a smaller share of revenue than construction, but an important contributor to profit and cash generation because toll roads and similar assets can produce steadier returns than contracting activity.
The business mix matters because reported revenue alone does not fully explain economic value. Construction can dominate sales, while infrastructure and insurance can have a disproportionate influence on margins, recurring income, and dividend capacity.
The operating profile has also shifted in a notable way. Revenue has been relatively stable over the last few years, but gross profit and operating income improved sharply in the latest period, suggesting a more favorable mix, better project execution, or stronger contribution from higher-margin activities.
The flow of revenue to profit shows a useful pattern: total sales have not exploded over time, but profitability improved meaningfully in the latest year. Gross profit expanded much faster than revenue, which points to stronger margins rather than simple top-line expansion. That is important for a group like NWS, where quality of earnings matters more than headline sales growth.
Key Figures
| Metric | Value | Sector ⓘ |
|---|---|---|
| Date | Oct 17, 2026 | |
| Context | ||
| Sector | Industrials | |
| Industry | Engineering & Construction | |
| Market Cap ⓘ | $4.57B | |
| Beta ⓘ | 0.42 | |
Value (Cheapness) | ||
| P/E Ratio ⓘ | 14.93 | 22.10 |
| P/B Ratio ⓘ | 0.12 | 1.97 |
| FCF Yield ⓘ | 86.35% | 6.38% |
| Dividend Yield ⓘ | 8.08% | 1.94% |
| EBIT / EV ⓘ | 177.03% | 4.79% |
| PEG ⓘ | N/A | |
Growth (Business expansion) | ||
| Revenue Growth ⓘ | 17.20% | 9.30% |
| RPS Growth (5Y CAGR) ⓘ | -7.15% | 7.81% |
| EPS Growth (5Y CAGR) ⓘ | 1.52% | -13.06% |
| BVPS Growth (5Y CAGR) ⓘ | -10.80% | 6.14% |
| Margin Growth (5Y Trend) ⓘ | 13.96% | 0.88% |
| FCF Growth (5Y CAGR) ⓘ | N/A | 11.01% |
| DPS Growth (5Y CAGR) ⓘ | -32.44% | 9.48% |
Quality (Business durability) | ||
| ROIC (Latest) ⓘ | N/A | 10.84% |
| ROA (Latest) ⓘ | 2.80% | 5.41% |
| ROIC (5Y Median) ⓘ | 4.63% | 9.38% |
| ROA (5Y Median) ⓘ | 1.44% | 4.95% |
| Net Debt / EBIT (Latest) ⓘ | 2.02 | 2.08 |
| Net Debt / EBIT (5Y Median) ⓘ | 2.75 | 2.27 |
| Net Debt / EBITDA (Latest) ⓘ | 1.39 | 1.39 |
| Net Debt / Assets ⓘ | 8.75% | 19.28% |
| EBITDA / Interest ⓘ | 2.58 | 9.58 |
| Operating Margin (Latest) ⓘ | 16.15% | 10.50% |
| Operating Margin (5Y Median) ⓘ | 17.64% | 10.29% |
| Debt to Equity (Latest) ⓘ | 94.41% | 65.48% |
| Profit Margin (Latest) ⓘ | 9.49% | 6.67% |
| Free Cash Flow (Latest) ⓘ | $3.94B | |
Momentum (Price trend) | ||
| 3Y Return ⓘ | +50.52% | +61.68% |
| 12M Return (excl. last month) ⓘ | +20.24% | +12.58% |
| 6M Return ⓘ | +0.30% | 0.00% |
| Price vs. 200-Day MA ⓘ | +4.09% | +0.02% |
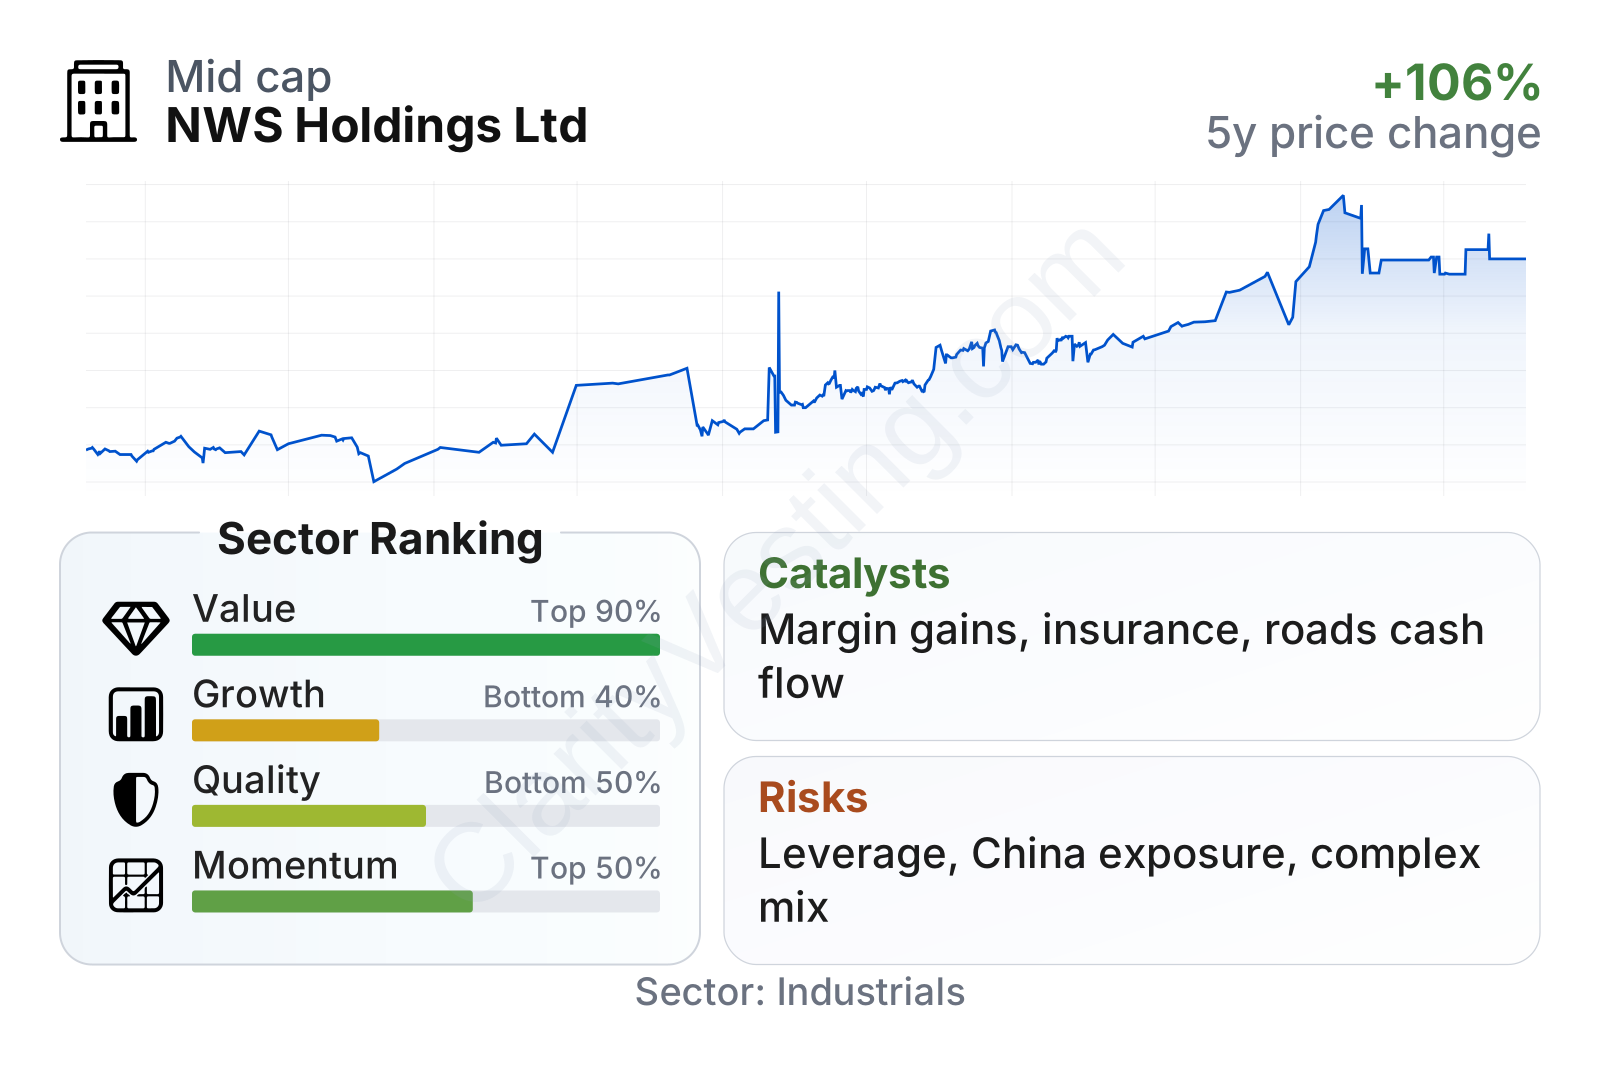
NWS is a mid-sized company with a relatively low stock volatility profile, reflected in a beta well below 1. In valuation terms, it screens as unusually cheap versus the broader industrial sector: its earnings multiple is below the sector median, its price-to-book ratio is far below typical peers, and its free cash flow yield is exceptionally high. The dividend yield is also far above the sector norm.
That attractive valuation picture comes with trade-offs. Growth metrics are mixed: recent year-over-year revenue growth has been solid, but the longer five-year picture is much weaker, with declines in revenue per share, book value per share, and dividends per share. Quality is also uneven. Profit margins and operating margins are better than many sector peers, but returns on assets and capital are more modest, and interest coverage is clearly weaker than the sector median. In short, the table points to a company that looks cheap and cash-generative, but not consistently high-quality or fast-growing.
The stock chart shows a strong rise from 2021 through 2026, although momentum softened more recently after reaching a higher level earlier in 2026. That pattern matches the broader picture: the market has re-rated the shares upward, but the company still trades on metrics that imply skepticism about the durability of current earnings and cash flow.
Growth
NWS operates in sectors that have different growth profiles. Construction and engineering tend to follow economic cycles, public works spending, and private real estate activity. Roads and infrastructure usually grow more slowly, but they can provide durable cash flow with inflation-linked characteristics in some cases. Insurance can offer longer-term expansion if underwriting discipline and investment returns remain sound. Logistics has structural support from cross-border trade and supply-chain outsourcing, though it is also sensitive to global trade conditions.
For long-term business development, the company’s strategy is broadly understandable: combine recurring infrastructure-like income with service businesses that can scale, while maintaining exposure to Hong Kong and mainland China-linked economic activity. The appeal of that model is diversification. If construction slows, roads, insurance, or logistics can help cushion results. The limitation is that diversification can also make the group harder to value and can dilute management focus.
A notable positive is margin improvement. The latest operating performance suggests that NWS is not relying only on revenue expansion; it is also improving the profitability of what it already owns or operates. That can be a stronger driver of shareholder value than low-margin sales growth. Recent annual revenue growth has also been ahead of the sector median, showing that the business is not stagnant in the near term even if its five-year growth record is less impressive.
The strongest potential catalysts appear to be continued optimization of the portfolio, stable cash generation from roads and insurance, and any evidence that the higher-margin mix seen recently can be sustained. If the group keeps converting earnings into free cash flow at current levels, that could remain one of the central reasons the stock attracts attention despite modest sector positioning on growth and quality measures.
Risks
This article is for informational purposes only and does not constitute financial advice. Some content is AI-generated. See Disclaimer


