Stock Analysis · NWPX Infrastructure Inc (NWPX)
Overview
NWPX Infrastructure Inc operates in steel-related infrastructure markets. The business is tied to construction, utility, transportation, and public works demand, with products that support physical networks such as water, wastewater, storm drainage, and other civil infrastructure applications. In simple terms, it sells essential steel-based products used in projects that cities, utilities, contractors, and industrial customers need to build or maintain infrastructure.
Public company materials indicate that the business has historically been centered on engineered steel products for infrastructure end markets rather than commodity steelmaking alone. That matters for long-term analysis because demand is influenced not only by steel prices, but also by public infrastructure budgets, private construction activity, replacement of aging systems, and project pipelines.
Detailed segment percentages were not available in the material reviewed here with enough precision to present a reliable breakdown. At a high level, revenue appears to come mainly from:
- Sales of steel pipe and related infrastructure products used in water transmission, wastewater, drainage, and civil construction projects.
- Engineered or fabricated steel solutions tied to transportation, utility, and industrial infrastructure work.
- Associated project-driven product mix and services that can vary depending on contract timing and end-market demand.
The overall revenue profile has been improving over the last several years. Annual sales rose from roughly $333 million in 2021 to about $526 million in 2025, while gross profit and operating income also expanded. One notable feature is that interest expense fell meaningfully in 2025 even as revenue increased, suggesting a healthier financial structure.
Key Figures
| Metric | Value | Sector ⓘ |
|---|---|---|
| Date | Oct 17, 2026 | |
| Context | ||
| Sector | Basic Materials | |
| Industry | Steel | |
| Market Cap ⓘ | $992.25M | |
| Beta ⓘ | 1.08 | |
Value (Cheapness) | ||
| P/E Ratio ⓘ | 21.23 | 16.90 |
| P/B Ratio ⓘ | 2.41 | 1.65 |
| FCF Yield ⓘ | 8.03% | 5.76% |
| Dividend Yield ⓘ | N/A | 2.13% |
| EBIT / EV ⓘ | 6.07% | 6.30% |
| PEG ⓘ | 1.82 | |
Growth (Business expansion) | ||
| Revenue Growth ⓘ | 19.70% | 11.10% |
| RPS Growth (5Y CAGR) ⓘ | 12.07% | 4.49% |
| EPS Growth (5Y CAGR) ⓘ | -5.67% | -13.47% |
| BVPS Growth (5Y CAGR) ⓘ | 8.62% | 5.51% |
| Margin Growth (5Y Trend) ⓘ | 4.43% | -1.54% |
| FCF Growth (5Y CAGR) ⓘ | N/A | 0.37% |
| DPS Growth (5Y CAGR) ⓘ | N/A | 6.08% |
Quality (Business durability) | ||
| ROIC (Latest) ⓘ | 11.99% | 9.26% |
| ROA (Latest) ⓘ | 7.76% | 4.91% |
| ROIC (5Y Median) ⓘ | 8.67% | 7.70% |
| ROA (5Y Median) ⓘ | 5.42% | 3.86% |
| Net Debt / EBIT (Latest) ⓘ | 1.25 | 1.40 |
| Net Debt / EBIT (5Y Median) ⓘ | 4.11 | 1.70 |
| Net Debt / EBITDA (Latest) ⓘ | 0.95 | 0.95 |
| Net Debt / Assets ⓘ | 12.47% | 13.69% |
| EBITDA / Interest ⓘ | 45.49 | 12.34 |
| Operating Margin (Latest) ⓘ | 11.30% | 13.20% |
| Operating Margin (5Y Median) ⓘ | 9.34% | 11.80% |
| Debt to Equity (Latest) ⓘ | 24.03% | 40.56% |
| Profit Margin (Latest) ⓘ | 8.49% | 6.43% |
| Free Cash Flow (Latest) ⓘ | $79.65M | |
Momentum (Price trend) | ||
| 3Y Return ⓘ | +241.27% | +68.89% |
| 12M Return (excl. last month) ⓘ | +106.44% | +30.21% |
| 6M Return ⓘ | +30.73% | -4.16% |
| Price vs. 200-Day MA ⓘ | +4.16% | -1.27% |
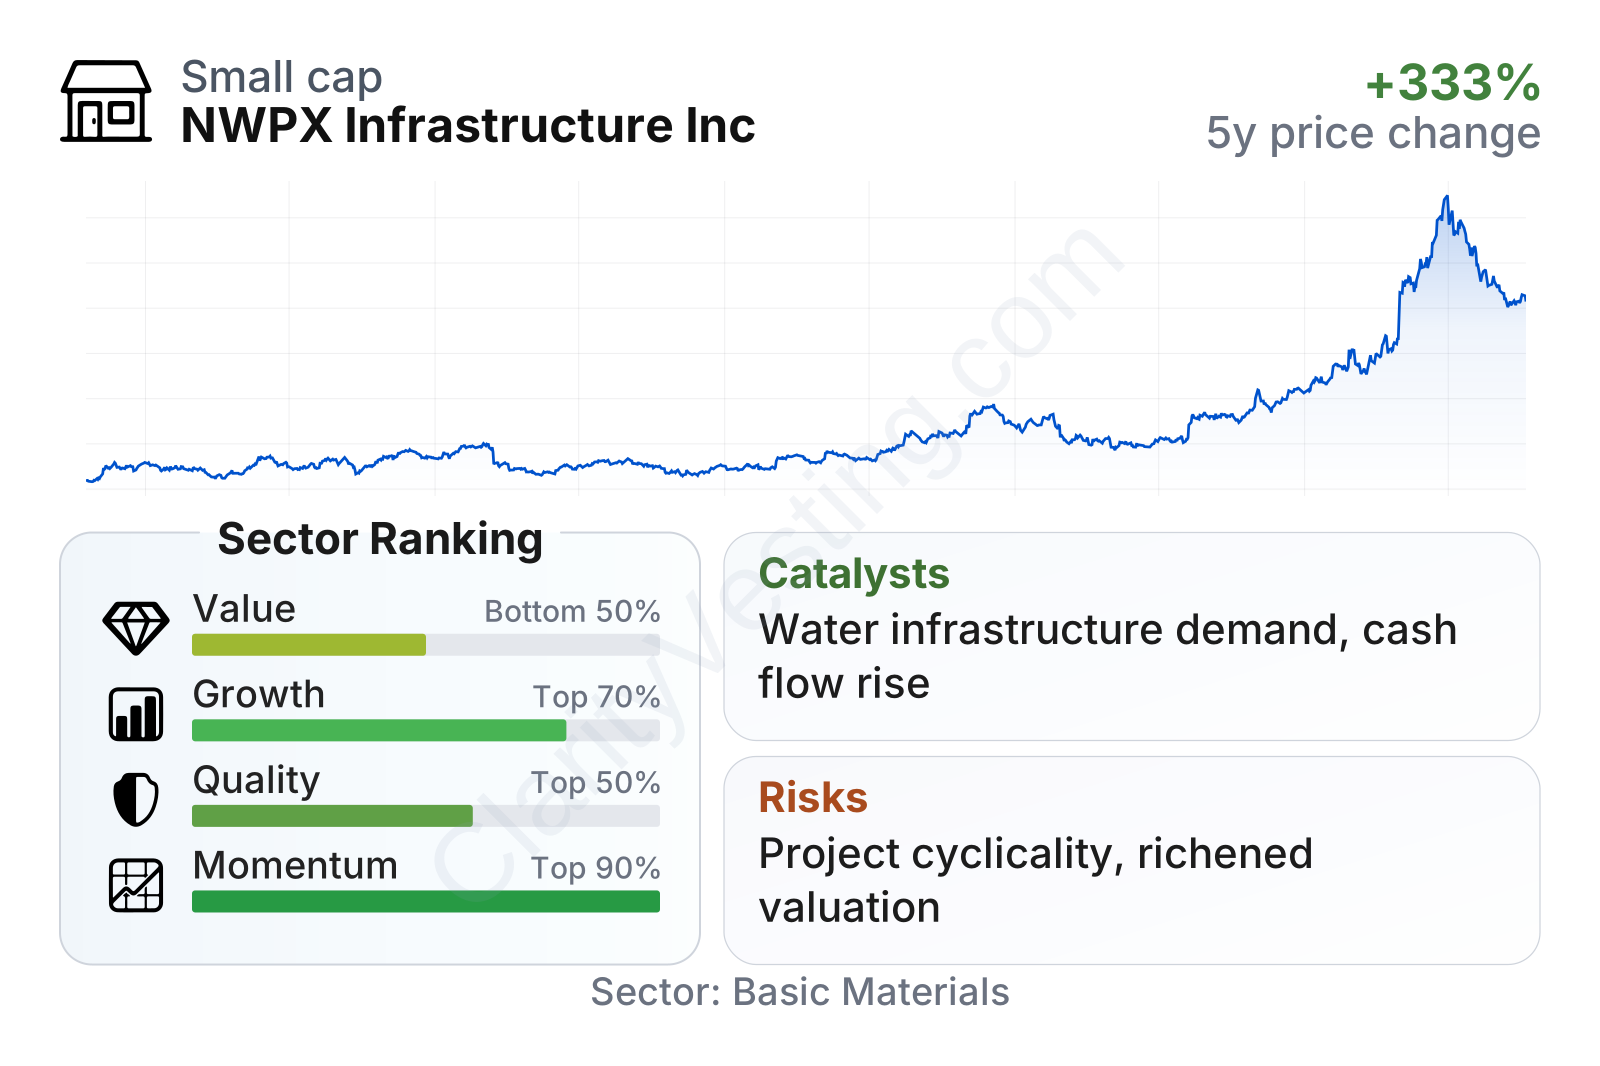
NWPX is a relatively small public company, with a market value around $1 billion, so its shares can move more sharply than those of larger industrial groups. The recent profile is mixed but generally solid: growth ranks above much of the sector, quality is around the middle-to-better end, and share-price momentum has been especially strong. On valuation, the stock does not screen as obviously cheap on earnings or book value, although cash generation looks better than those headline multiples suggest.
The stock chart shows a major rerating over the last two years, with especially sharp appreciation into 2026. That move usually means the market is already recognizing better operating performance and improved expectations, which raises the bar for future execution.
Growth
NWPX operates in a part of the market that can benefit from long-duration infrastructure needs. Water systems, drainage networks, transportation assets, and utility-related construction all require periodic replacement and expansion. These are not short-lived themes. In the United States, aging infrastructure and multi-year public funding programs can support demand over an extended period, although project timing can still be uneven from quarter to quarter.
The company’s recent numbers support the idea that it is participating in a favorable environment. Revenue growth has returned to a healthy level after a softer period in 2023 and early 2025. The latest year-over-year pace is close to 20%, which is ahead of the sector median and also consistent with a stronger five-year revenue-per-share trend than many peers.
Another encouraging point is cash generation. Free cash flow has been volatile, which is common in project-oriented industrial businesses, but the recent trend has clearly improved. Trailing free cash flow moved from negative territory in weaker periods to more than $70 million recently, giving the company more flexibility to reduce debt, fund working capital, or support expansion.
Its strategy also appears sensible for future growth because infrastructure-oriented steel applications can be more specialized and less purely price-driven than standard commodity exposure. If management continues to focus on end markets where engineering requirements, approvals, and customer relationships matter, that can create a more durable business mix over time.
A meaningful recent catalyst is the acceleration in market recognition visible in the share price and growth metrics. While stock performance itself is not a business fundamental, such a move often reflects improving expectations around margins, project activity, and cash flow. For NWPX, the combination of stronger sales growth, better profitability, and reduced leverage gives the company a more credible platform for continued expansion than it had several years ago.
Risks
This article is for informational purposes only and does not constitute financial advice. Some content is AI-generated. See Disclaimer


