Stock Analysis · Northwest Natural Gas Co (NWN)
Overview
Northwest Natural Holding Company, through Northwest Natural Gas Co and related subsidiaries, is a regulated utility group focused primarily on natural gas distribution in the Pacific Northwest. Its core business is delivering natural gas to residential, commercial, and industrial customers, mainly in Oregon and southwest Washington. Over time, the company has also expanded into water and wastewater utilities and into smaller renewable natural gas and other utility-adjacent activities.
For a long-term reader, the key point is that this is not a fast-changing technology company. It is a utility operator whose earnings are shaped mainly by customer growth, approved rate increases, infrastructure investment, weather patterns, and the cost of financing. That usually creates steadier demand than in many industries, but also limits how quickly profits can grow.
Based on recent company disclosures, revenue is still heavily concentrated in gas utility operations, with a smaller contribution from water and wastewater services and other businesses. The mix can move from year to year because purchased gas costs are passed through to customers and can materially change reported revenue without changing underlying profitability.
- Natural gas utility: approximately 85% to 90% of total revenue. This includes regulated gas sales, transportation, and related service charges.
- Water and wastewater utility: approximately 5% to 10% of total revenue. This includes regulated water distribution and wastewater services from acquired utility systems.
- Other activities: less than 10% of total revenue. This typically includes appliance services and emerging utility-related businesses such as renewable natural gas development.
The broad financial flow is also typical for a utility: a large share of revenue goes to purchased gas and operating costs, while earnings depend on maintaining healthy margins after depreciation, taxes, and interest expense. One notable recent feature is that operating income improved meaningfully by 2025, but interest expense also climbed, showing how important borrowing costs have become for the company.
Key Figures
| Metric | Value | Sector ⓘ |
|---|---|---|
| Date | Oct 17, 2026 | |
| Context | ||
| Sector | Utilities | |
| Industry | Utilities - Regulated Gas | |
| Market Cap ⓘ | $2.05B | |
| Beta ⓘ | 0.39 | |
Value (Cheapness) | ||
| P/E Ratio ⓘ | 16.19 | 17.28 |
| P/B Ratio ⓘ | 1.32 | 1.51 |
| FCF Yield ⓘ | -12.96% | 0.65% |
| Dividend Yield ⓘ | 4.06% | 3.77% |
| EBIT / EV ⓘ | 6.05% | 5.01% |
| PEG ⓘ | 2.31 | |
Growth (Business expansion) | ||
| Revenue Growth ⓘ | 3.10% | 6.10% |
| RPS Growth (5Y CAGR) ⓘ | 2.99% | 3.87% |
| EPS Growth (5Y CAGR) ⓘ | -3.26% | -11.30% |
| BVPS Growth (5Y CAGR) ⓘ | 4.32% | 4.23% |
| Margin Growth (5Y Trend) ⓘ | 3.15% | 3.57% |
| FCF Growth (5Y CAGR) ⓘ | N/A | -8.84% |
| DPS Growth (5Y CAGR) ⓘ | 0.94% | 4.84% |
Quality (Business durability) | ||
| ROIC (Latest) ⓘ | 4.97% | 6.53% |
| ROA (Latest) ⓘ | 2.05% | 3.20% |
| ROIC (5Y Median) ⓘ | 4.94% | 5.95% |
| ROA (5Y Median) ⓘ | 1.96% | 2.75% |
| Net Debt / EBIT (Latest) ⓘ | 9.48 | 7.13 |
| Net Debt / EBIT (5Y Median) ⓘ | 9.94 | 7.23 |
| Net Debt / EBITDA (Latest) ⓘ | 5.47 | 4.31 |
| Net Debt / Assets ⓘ | 41.57% | 38.42% |
| EBITDA / Interest ⓘ | 4.14 | 4.58 |
| Operating Margin (Latest) ⓘ | 21.85% | 20.83% |
| Operating Margin (5Y Median) ⓘ | 16.94% | 20.08% |
| Debt to Equity (Latest) ⓘ | 173.28% | 137.69% |
| Profit Margin (Latest) ⓘ | 9.74% | 11.37% |
| Free Cash Flow (Latest) ⓘ | -$265.98M | |
Momentum (Price trend) | ||
| 3Y Return ⓘ | +43.59% | +52.37% |
| 12M Return (excl. last month) ⓘ | +19.63% | +8.84% |
| 6M Return ⓘ | -8.59% | -3.95% |
| Price vs. 200-Day MA ⓘ | -0.83% | -0.79% |
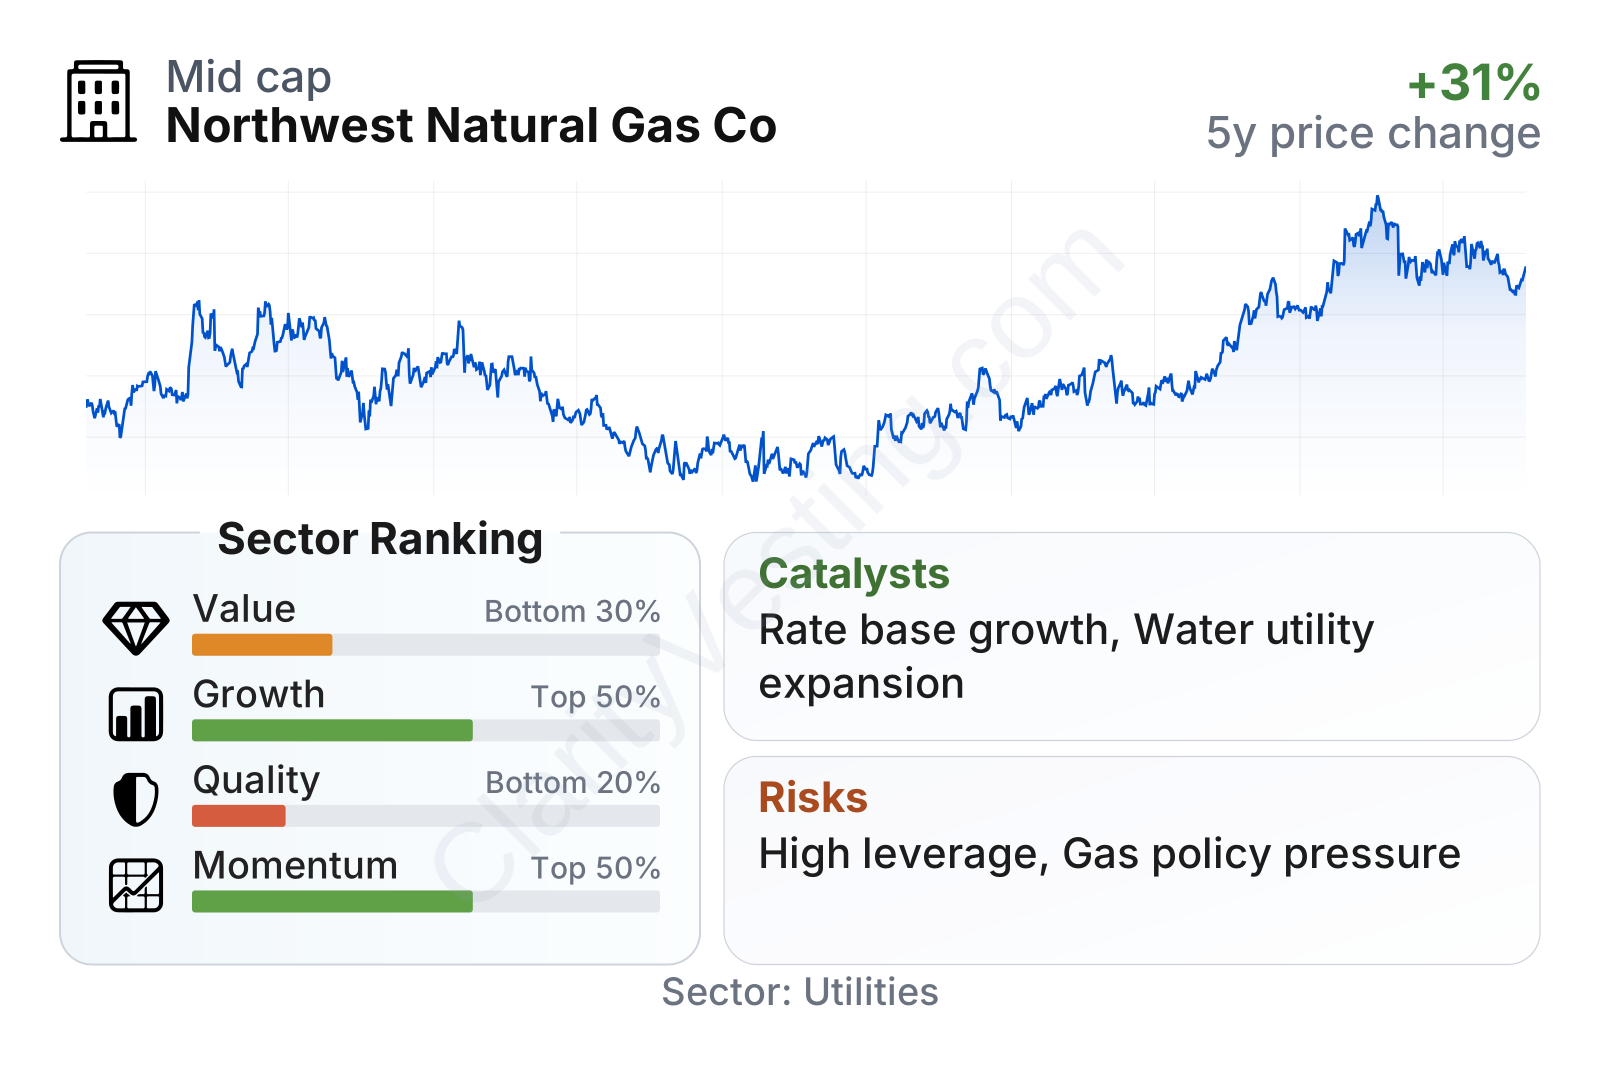
Northwest Natural is a small-cap utility with a low-beta profile, which means its stock has historically moved less than the broader market. In the factor breakdown, growth looks middle-of-the-pack for the sector, while quality ranks weaker. Valuation is not stretched compared with regulated utility peers: earnings and book-value multiples sit modestly below sector medians, and the dividend yield is slightly above the sector median. The main weak spot in the snapshot is cash generation, with free cash flow remaining negative because capital spending is running well above internally generated cash.
The stock price trend has been positive over the longer part of the period shown, especially through late 2025 and early 2026, although there has been some pullback more recently. That pattern fits a defensive utility that benefited from improving earnings expectations and the appeal of stable income, but it also suggests the market has already recognized some of the company’s strengths.
Growth
Northwest Natural operates in a mature utility industry rather than a high-growth sector, so the growth case is mostly about steady expansion instead of rapid disruption. That said, regulated utilities can still grow at a reasonable pace when they add customers, invest in new infrastructure that expands their rate base, and win approval for rates that allow recovery of those investments. In that sense, the company’s strategy is coherent: it is building around essential local utility networks where demand tends to be resilient.
A second growth layer comes from water and wastewater. This business is still much smaller than gas distribution, but it gives the company another regulated platform with long-lived assets and consolidation opportunities. Water utilities can be attractive because many local systems are small and fragmented, which can create room for acquisitions and infrastructure upgrades over time.
Revenue per share has moved upward over the last five years, though not in a straight line. The overall trend points to gradual expansion rather than acceleration. Recent annual revenue growth of about 3% is below the sector median near 6%, so the company is growing, but not quickly enough to stand out on topline momentum alone.
One important nuance is that weak free cash flow does not automatically signal a broken business in utilities. Negative free cash flow often reflects heavy capital investment in pipes, storage, safety, and system upgrades. For Northwest Natural, that pattern appears persistent, which supports future rate-base growth but also increases reliance on external financing. In other words, part of the growth plan is real and visible in infrastructure spending, but it comes with a higher funding burden.
As for catalysts, the most meaningful ones are likely to come from continued customer additions in its service territories, rate decisions that support returns on invested capital, and further scaling of the water and wastewater platform. The company has also been positioning around cleaner-fuels themes such as renewable natural gas, which could become more relevant if state policy and customer demand continue to favor lower-carbon energy options. A regulated utility does not usually have one dramatic breakthrough event, but a series of favorable regulatory outcomes and disciplined capital deployment can materially improve earnings over time.
Risks
This article is for informational purposes only and does not constitute financial advice. Some content is AI-generated. See Disclaimer


