Stock Analysis · Newell Brands Inc (NWL)
Overview
Newell Brands Inc is a consumer products company that owns a wide portfolio of everyday brands used at home, in schools, outdoors, and in food storage. Its products are sold through large retailers, e-commerce channels, office suppliers, specialty stores, and distributors. The group is best known for brands such as Rubbermaid, Sharpie, Graco, Coleman, Yankee Candle, Elmer’s, EXPO, Paper Mate, Oster, FoodSaver, and NUK.
In its current structure, Newell reports three main operating segments. Based on recent annual filings, revenue is spread approximately as follows:
- Home and Commercial Solutions: about 40% of revenue. This segment includes food storage, home organization, kitchen products, commercial cleaning and maintenance products, and connected or appliance-related home items. Key brands include Rubbermaid, FoodSaver, Calphalon, Sistema, Oster, and Mr. Coffee.
- Learning and Development: about 35% of revenue. This segment covers writing instruments, art supplies, baby gear, baby care, and educational products. Key brands include Sharpie, Paper Mate, EXPO, Elmer’s, Graco, NUK, and Baby Jogger.
- Outdoor and Recreation: about 25% of revenue. This business includes outdoor equipment and recreation-focused products, notably Coleman and camping-related items, along with recreation and outdoor cooking categories.
Geographically, the business is still centered on the United States, which accounts for the clear majority of sales, with the remainder coming from international markets across Europe, Latin America, Canada, and Asia-Pacific. That mix gives Newell meaningful scale in North America, but it also means the company is heavily exposed to U.S. retail conditions and consumer spending trends.
Over the last several years, the business has become smaller in revenue terms as management has simplified the portfolio, exited or divested brands, and tried to focus on stronger categories. The broad direction is easier to understand than it was in the past, but the company is still in the middle of a long repair process rather than operating from a position of strength.
The long-term picture shows a clear drop in revenue from above $10 billion in 2021 to a little above $7 billion more recently. Gross profit has held up better than sales, which suggests some benefit from pricing, mix, and portfolio pruning, but operating profit has been squeezed badly by overhead, restructuring, and interest costs.
Key Figures
| Metric | Value | Sector ⓘ |
|---|---|---|
| Date | Oct 17, 2026 | |
| Context | ||
| Sector | Consumer Defensive | |
| Industry | Household & Personal Products | |
| Market Cap ⓘ | $2.38B | |
| Beta ⓘ | 0.87 | |
Value (Cheapness) | ||
| P/E Ratio ⓘ | N/A | 17.88 |
| P/B Ratio ⓘ | 0.98 | 1.29 |
| FCF Yield ⓘ | 4.97% | 12.39% |
| Dividend Yield ⓘ | 4.96% | 2.85% |
| EBIT / EV ⓘ | 2.08% | 6.43% |
| PEG ⓘ | 0.97 | |
Growth (Business expansion) | ||
| Revenue Growth ⓘ | 3.00% | 4.10% |
| RPS Growth (5Y CAGR) ⓘ | -8.65% | 6.18% |
| EPS Growth (5Y CAGR) ⓘ | -32.56% | -13.59% |
| BVPS Growth (5Y CAGR) ⓘ | -12.41% | 3.20% |
| Margin Growth (5Y Trend) ⓘ | -9.32% | -0.15% |
| FCF Growth (5Y CAGR) ⓘ | -58.89% | 4.10% |
| DPS Growth (5Y CAGR) ⓘ | -25.28% | 6.79% |
Quality (Business durability) | ||
| ROIC (Latest) ⓘ | 0.34% | 12.34% |
| ROA (Latest) ⓘ | -1.98% | 6.30% |
| ROIC (5Y Median) ⓘ | 0.36% | 10.49% |
| ROA (5Y Median) ⓘ | -1.86% | 5.44% |
| Net Debt / EBIT (Latest) ⓘ | 32.77 | 1.96 |
| Net Debt / EBIT (5Y Median) ⓘ | 77.66 | 2.35 |
| Net Debt / EBITDA (Latest) ⓘ | 11.15 | 1.38 |
| Net Debt / Assets ⓘ | 48.00% | 21.51% |
| EBITDA / Interest ⓘ | 1.38 | 9.46 |
| Operating Margin (Latest) ⓘ | 2.24% | 8.87% |
| Operating Margin (5Y Median) ⓘ | 0.46% | 9.53% |
| Debt to Equity (Latest) ⓘ | 226.11% | 72.35% |
| Profit Margin (Latest) ⓘ | -3.05% | 5.40% |
| Free Cash Flow (Latest) ⓘ | $118.00M | |
Momentum (Price trend) | ||
| 3Y Return ⓘ | -4.59% | +20.92% |
| 12M Return (excl. last month) ⓘ | +5.59% | +2.13% |
| 6M Return ⓘ | +49.41% | +1.26% |
| Price vs. 200-Day MA ⓘ | +20.46% | +1.39% |
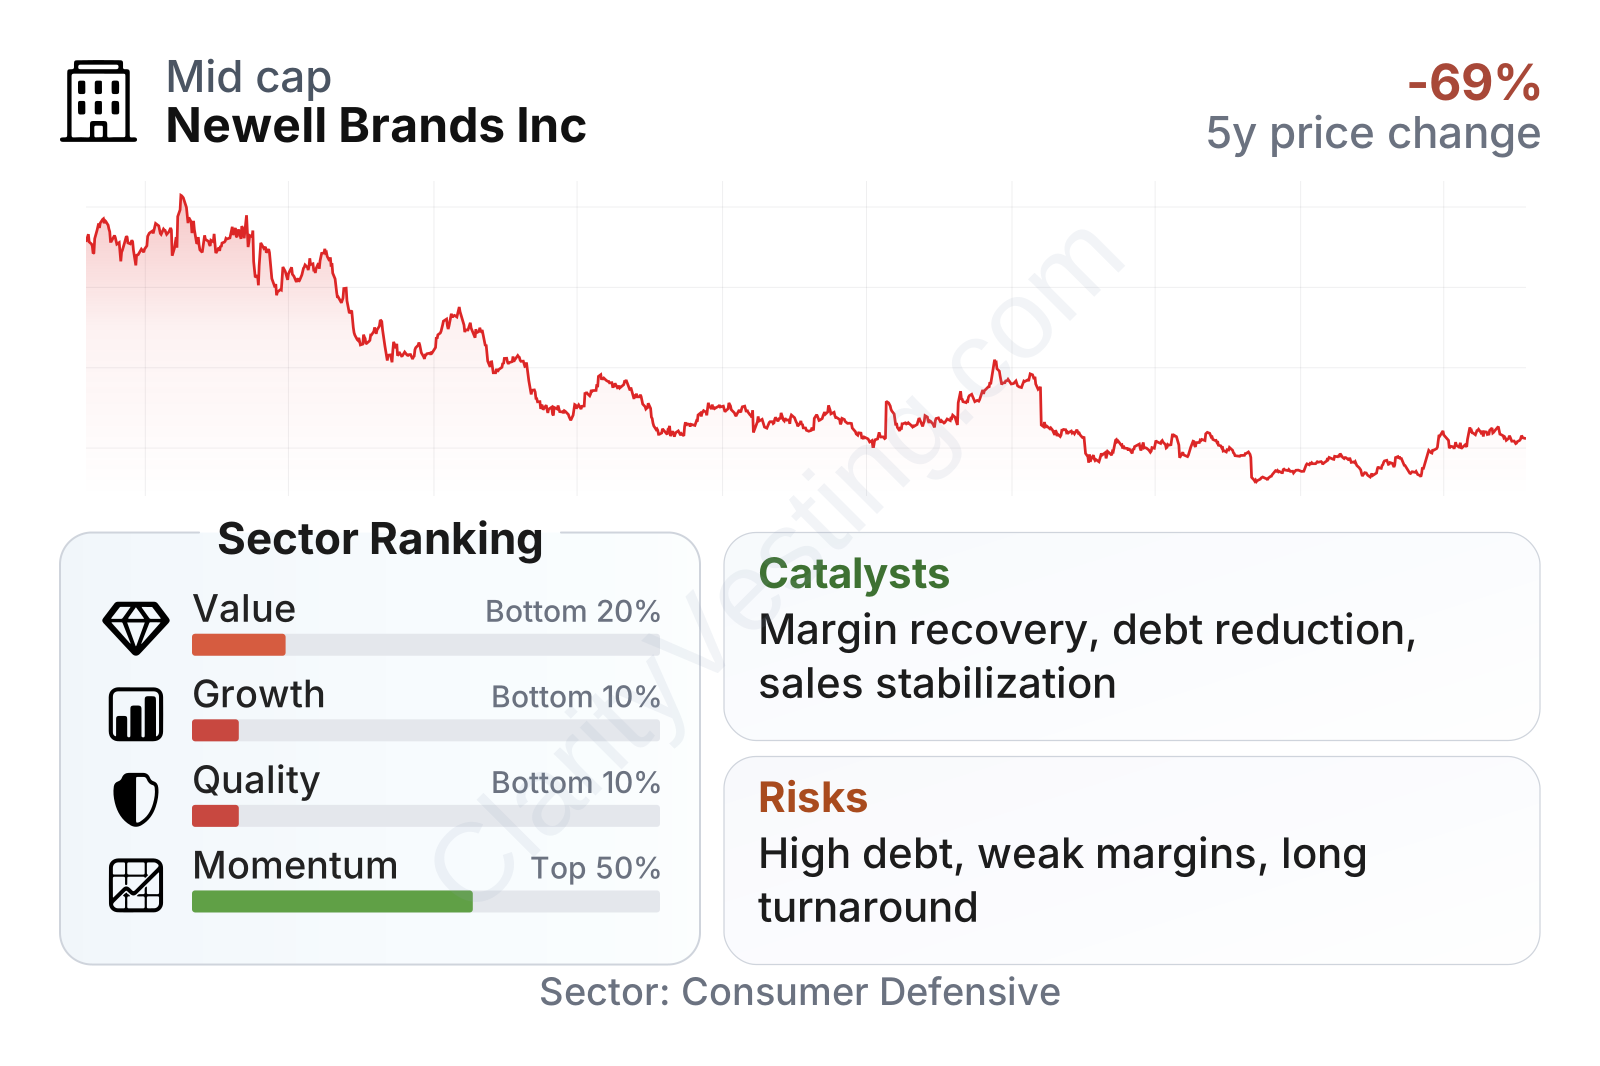
Newell is now a mid-sized consumer products company after several years of contraction. The stock has rebounded sharply over the last six months, but that recovery comes after a very steep multiyear decline. The table also points to an unusual mix: recent price momentum has improved, yet the company still ranks poorly on growth and quality compared with most peers in the household and personal products universe. The headline valuation multiples can look low, but they sit alongside weak profitability, heavy leverage, and very thin operating returns.
Growth
Newell operates in categories that are generally stable rather than fast-growing. Household goods, writing products, baby items, and outdoor equipment benefit from recurring consumer demand, but they do not usually deliver rapid structural expansion. That means future growth depends less on the sector itself and more on execution: product innovation, better shelf placement, pricing discipline, supply chain improvements, and stronger online performance.
The company’s current strategy is centered on simplification and operational improvement. Management has been working to reduce complexity, lower costs, improve gross margin, and focus spending on brands with stronger consumer recognition. In principle, that strategy makes sense. A business with many established brands can recover if it restores margins, improves inventory management, and concentrates on categories where consumers already know the labels. The challenge is that Newell has been trying to stabilize the business while carrying a significant debt burden and dealing with demand softness in several categories.
Revenue trends show how difficult the turnaround has been. Annual sales declines were severe through 2022, 2023, 2024, and 2025, although the pace of decline moderated over time. The most recent year-over-year reading has turned slightly positive, around 3%, which is important mainly because it may signal that the company is finally nearing a base of stabilization rather than continuing a broad contraction.
Cash generation has also been uneven. Free cash flow swung from positive to negative and back again over the last few years, which is not unusual during a restructuring, but it reduces financial flexibility. The latest trailing figure is positive, though still modest for a company of this size. For long-term analysis, one of the biggest possible catalysts is not rapid sales growth but steadier cash generation that can support debt reduction and give management more room to reinvest in brands.
A practical catalyst is the company’s ability to continue productivity and restructuring efforts while holding gross margin. Another is category normalization in areas that have been under pressure, especially discretionary and retail-sensitive lines such as outdoor products and some home-related categories. If Newell can combine stable sales with better margins, the earnings effect could be meaningful because profitability is currently so low.
Recent company updates have also emphasized brand investment, innovation launches, and supply chain actions. These are not transformational events on their own, but for a business in recovery, small operational wins can matter more than headline expansion.
Risks
This article is for informational purposes only and does not constitute financial advice. Some content is AI-generated. See Disclaimer


