Stock Analysis · nVent Electric PLC (NVT)
Overview
nVent Electric is an electrical equipment company focused on protecting, connecting, and managing electrical and data infrastructure. In simple terms, it sells products that help keep power systems, industrial equipment, buildings, utilities, and data centers safe, organized, and operating reliably. Its offerings include enclosures that shield electrical components, fastening and thermal management products, and electrical connection and power products used in commercial, industrial, utility, and infrastructure projects.
The business is organized around three main segments. Based on the company’s latest annual reporting structure, revenue is led by enclosure systems, followed by electrical and fastening solutions, then thermal management. Approximate revenue mix from largest to smallest is:
- Systems Protection: about 43% of revenue. This segment includes electrical enclosures, cabinets, cooling solutions, and related products used to protect controls, wiring, and equipment in industrial, commercial, and infrastructure settings.
- Electrical Connections: about 34% of revenue. This includes grounding, bonding, surge protection, rail products, and other solutions that connect and protect electrical systems.
- Thermal Management: about 23% of revenue. This covers electric heat tracing and thermal solutions used in industrial facilities, energy infrastructure, and buildings to maintain temperatures and protect pipes, tanks, and critical systems.
nVent’s customer exposure is fairly diversified across industrial markets, commercial construction, utilities, infrastructure, energy, and data-related applications. That diversification matters because it reduces reliance on any single end market, even though results can still move with broader capital spending cycles.
The company’s financial profile has improved meaningfully over the last several years. Revenue has climbed from roughly $2.5 billion in 2021 to nearly $3.9 billion in 2025, while net income and operating profit have also expanded over time despite some year-to-year volatility. Gross profit has grown faster than sales over the period, which suggests a stronger mix and pricing discipline rather than simple volume growth alone.
The long-term pattern points to a larger and more profitable business than it was a few years ago. Costs have increased as the company scaled, but earnings have generally risen faster than revenue over the full period, especially after portfolio changes and stronger exposure to higher-value electrical infrastructure markets.
Key Figures
| Metric | Value | Sector ⓘ |
|---|---|---|
| Date | Oct 24, 2026 | |
| Context | ||
| Sector | Industrials | |
| Industry | Electrical Equipment & Parts | |
| Market Cap ⓘ | $22.62B | |
| Beta ⓘ | 1.34 | |
Value (Cheapness) | ||
| P/E Ratio ⓘ | 38.72 | 22.29 |
| P/B Ratio ⓘ | 6.01 | 1.98 |
| FCF Yield ⓘ | 2.55% | 6.26% |
| Dividend Yield ⓘ | 0.58% | 1.92% |
| EBIT / EV ⓘ | 3.01% | 4.83% |
| PEG ⓘ | 1.03 | |
Growth (Business expansion) | ||
| Revenue Growth ⓘ | 52.80% | 9.30% |
| RPS Growth (5Y CAGR) ⓘ | 13.00% | 7.76% |
| EPS Growth (5Y CAGR) ⓘ | 4.42% | -13.17% |
| BVPS Growth (5Y CAGR) ⓘ | 11.41% | 6.13% |
| Margin Growth (5Y Trend) ⓘ | 1.72% | 0.74% |
| FCF Growth (5Y CAGR) ⓘ | 2.74% | 10.79% |
| DPS Growth (5Y CAGR) ⓘ | 3.38% | 9.41% |
Quality (Business durability) | ||
| ROIC (Latest) ⓘ | 12.17% | 10.75% |
| ROA (Latest) ⓘ | 8.58% | 5.41% |
| ROIC (5Y Median) ⓘ | 13.79% | 9.37% |
| ROA (5Y Median) ⓘ | 8.35% | 4.95% |
| Net Debt / EBIT (Latest) ⓘ | 1.65 | 2.04 |
| Net Debt / EBIT (5Y Median) ⓘ | 2.89 | 2.27 |
| Net Debt / EBITDA (Latest) ⓘ | 1.29 | 1.39 |
| Net Debt / Assets ⓘ | 19.27% | 19.27% |
| EBITDA / Interest ⓘ | 14.23 | 9.58 |
| Operating Margin (Latest) ⓘ | 17.26% | 10.49% |
| Operating Margin (5Y Median) ⓘ | 16.05% | 10.30% |
| Debt to Equity (Latest) ⓘ | 40.96% | 64.82% |
| Profit Margin (Latest) ⓘ | 12.38% | 6.67% |
| Free Cash Flow (Latest) ⓘ | $577.70M | |
Momentum (Price trend) | ||
| 3Y Return ⓘ | +216.79% | +67.77% |
| 12M Return (excl. last month) ⓘ | +62.14% | +12.05% |
| 6M Return ⓘ | +6.96% | 0.00% |
| Price vs. 200-Day MA ⓘ | +1.62% | +0.67% |
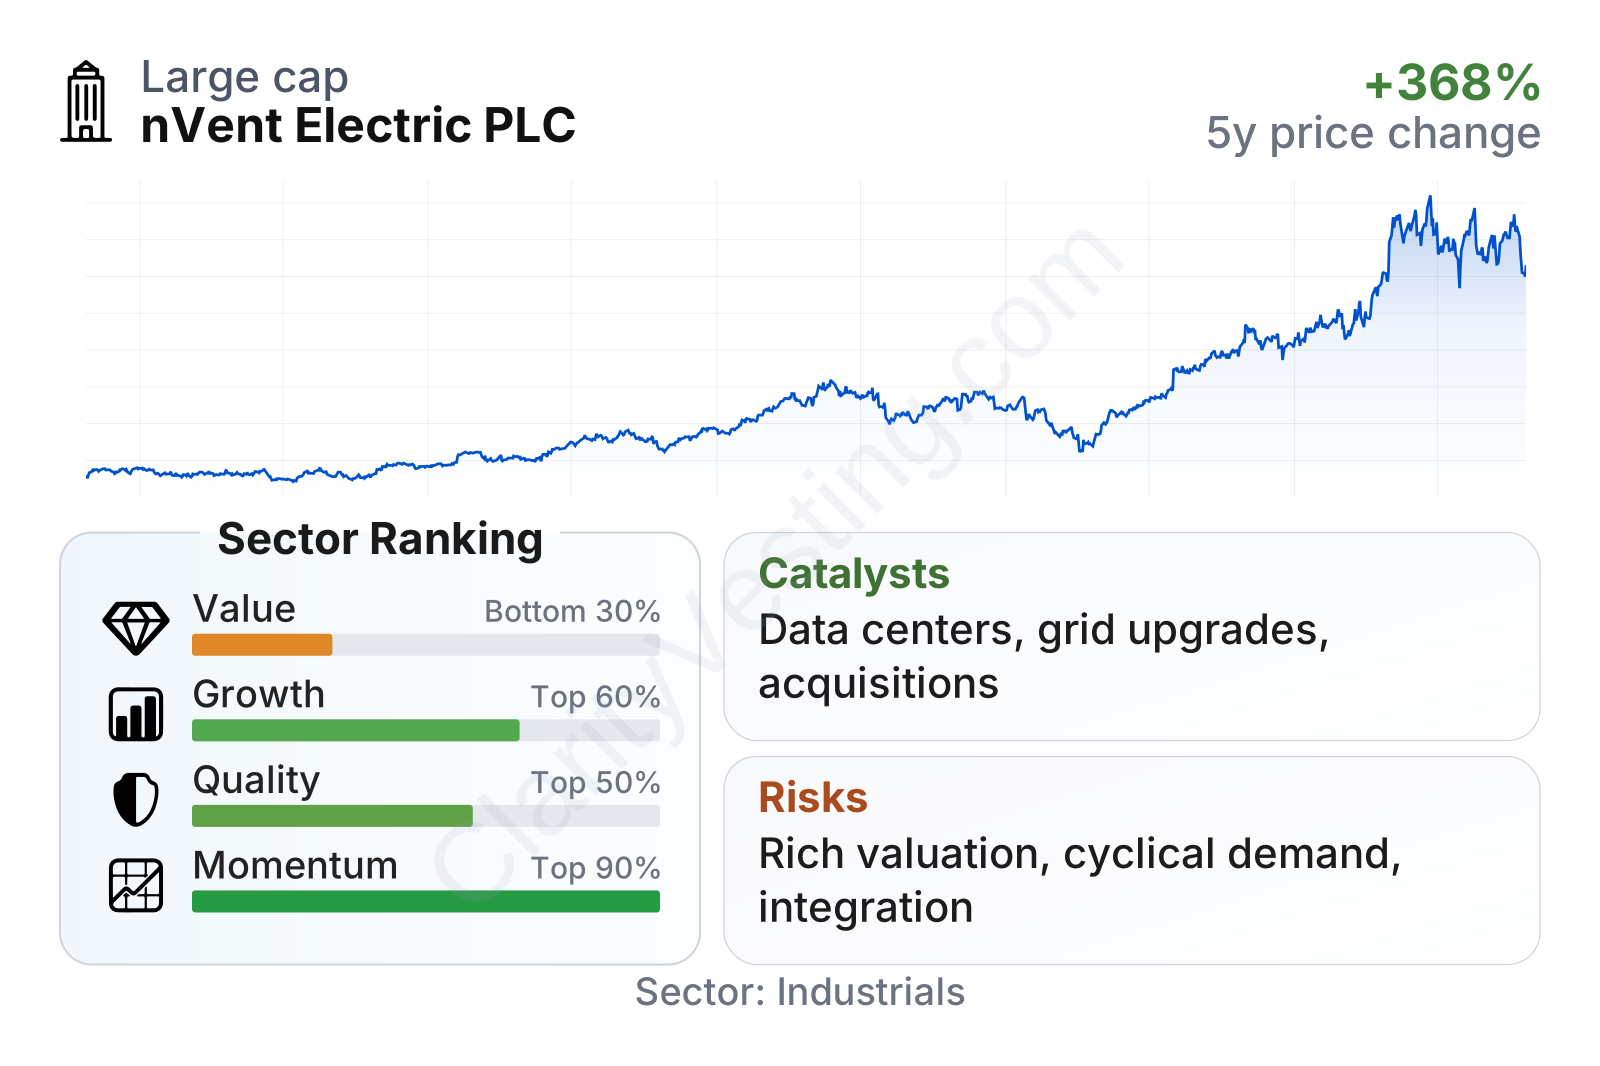
nVent is now a large industrial company by market value, and its share price momentum has been exceptionally strong compared with most companies in its sector. Growth and quality metrics look solid overall, with profitability and returns on assets running above industry medians. The main weak point in the snapshot is valuation: earnings, book value, cash flow yield, and dividend yield all indicate a stock that is trading at a clear premium to the sector.
Growth
nVent operates in parts of the market that are benefiting from several durable themes: grid modernization, electrification, factory automation, energy transition projects, and especially the expansion of data centers. These are not short-lived trends. As electricity use becomes more complex and digital infrastructure becomes more power-dense, demand tends to increase for enclosure systems, connection products, grounding, and thermal control solutions.
The company’s strategy also appears coherent. Management has been reshaping the portfolio toward faster-growing and higher-margin electrical infrastructure categories. That matters because not all industrial growth is equal: products tied to mission-critical electrical systems and data infrastructure often carry better margins, repeat demand, and stronger switching costs than more standardized hardware businesses.
One major recent catalyst is the company’s push into data center and power utility exposure, where reliability and heat management are essential. Public company updates have also highlighted acquisitions and portfolio moves aimed at strengthening these categories. If integration goes well, this can support both revenue growth and margin expansion through a better business mix.
Revenue growth has not been perfectly smooth, but the recent trend is strikingly strong. After a softer patch in 2024, year-over-year growth accelerated sharply through 2025 and into 2026, rising well above the sector median. That suggests the current business mix is benefiting from a favorable demand cycle and possibly from acquisitions adding to reported growth.
Cash generation remains an important support for the growth case, even though it has not moved in a straight line. Free cash flow increased materially over several years before pulling back more recently. In practical terms, this still leaves the company with meaningful capacity to fund acquisitions, invest in operations, and return capital, but it also shows that rapid expansion does not always translate immediately into steadily rising cash flow.
Risks
This article is for informational purposes only and does not constitute financial advice. Some content is AI-generated. See Disclaimer