Stock Analysis · Envista Holdings Corp (NVST)
Overview
Envista Holdings Corp is a dental products company focused on equipment, consumables, and specialty technologies used by dentists, orthodontists, oral surgeons, and dental laboratories. Its portfolio spans imaging systems, treatment units, implant systems, orthodontic products, and the day-to-day supplies used in dental practices. In simple terms, Envista sells both the larger tools a dental office needs to operate and the recurring products used during patient treatment.
The company reports through two main business segments. Based on recent annual reporting, revenue is split approximately as follows:
- Specialty Products & Technologies: about 57% of revenue. This includes dental implants, orthodontic solutions, and digital imaging and software. Key brands include Nobel Biocare in implants and Ormco in orthodontics. This segment is generally more exposed to higher-value procedures and digital dentistry trends.
- Equipment & Consumables: about 43% of revenue. This includes treatment units, instrument systems, infection-prevention products, and a broad range of recurring dental consumables sold under brands such as KaVo and Kerr. This side of the business tends to have a steadier replacement and usage pattern tied to routine dental care.
Geographically, Envista generates a meaningful share of sales outside the United States, giving it broad exposure to global dental demand but also making results sensitive to currency movements and regional economic conditions.
Its business model combines recurring consumables with higher-ticket capital equipment and specialty procedures. That mix matters: consumables can provide stability, while imaging, implants, and orthodontics can lift growth when dental offices are spending confidently.
The long-term financial pattern shows a company that has kept gross profit at a solid level, but whose final earnings were hit by restructuring and impairment-related pressure in recent years. By 2025, revenue and operating income had improved from the weak period seen in 2023 and 2024, suggesting that the business core remained intact even though reported net income was volatile.
One clear takeaway from the financial flow is that Envista still converts a large share of sales into gross profit, but selling and administrative costs remain heavy. That helps explain why the company can generate cash while still showing uneven bottom-line earnings.
Key Figures
| Metric | Value | Sector ⓘ |
|---|---|---|
| Date | Oct 24, 2026 | |
| Context | ||
| Sector | Healthcare | |
| Industry | Medical Instruments & Supplies | |
| Market Cap ⓘ | $3.72B | |
| Beta ⓘ | 0.89 | |
Value (Cheapness) | ||
| P/E Ratio ⓘ | 39.31 | 25.42 |
| P/B Ratio ⓘ | 1.28 | 3.08 |
| FCF Yield ⓘ | 6.24% | 3.12% |
| Dividend Yield ⓘ | N/A | 1.85% |
| EBIT / EV ⓘ | 5.94% | 0.56% |
| PEG ⓘ | N/A | |
Growth (Business expansion) | ||
| Revenue Growth ⓘ | 7.10% | 7.50% |
| RPS Growth (5Y CAGR) ⓘ | 3.28% | 8.60% |
| EPS Growth (5Y CAGR) ⓘ | -21.85% | -17.73% |
| BVPS Growth (5Y CAGR) ⓘ | -5.32% | 3.72% |
| Margin Growth (5Y Trend) ⓘ | -6.98% | -0.57% |
| FCF Growth (5Y CAGR) ⓘ | -6.92% | 0.96% |
| DPS Growth (5Y CAGR) ⓘ | N/A | 6.69% |
Quality (Business durability) | ||
| ROIC (Latest) ⓘ | 2.12% | 3.17% |
| ROA (Latest) ⓘ | 1.69% | 2.98% |
| ROIC (5Y Median) ⓘ | 2.44% | 4.56% |
| ROA (5Y Median) ⓘ | 0.85% | 1.87% |
| Net Debt / EBIT (Latest) ⓘ | 1.82 | 1.34 |
| Net Debt / EBIT (5Y Median) ⓘ | 2.56 | 1.86 |
| Net Debt / EBITDA (Latest) ⓘ | 1.13 | 1.00 |
| Net Debt / Assets ⓘ | 8.26% | 5.06% |
| EBITDA / Interest ⓘ | 11.53 | 9.55 |
| Operating Margin (Latest) ⓘ | 8.92% | 9.25% |
| Operating Margin (5Y Median) ⓘ | 7.86% | 7.33% |
| Debt to Equity (Latest) ⓘ | 51.62% | 26.68% |
| Profit Margin (Latest) ⓘ | 3.33% | 3.34% |
| Free Cash Flow (Latest) ⓘ | $232.30M | |
Momentum (Price trend) | ||
| 3Y Return ⓘ | -3.19% | +51.61% |
| 12M Return (excl. last month) ⓘ | +15.75% | +19.90% |
| 6M Return ⓘ | -11.68% | +10.10% |
| Price vs. 200-Day MA ⓘ | -6.83% | +6.44% |
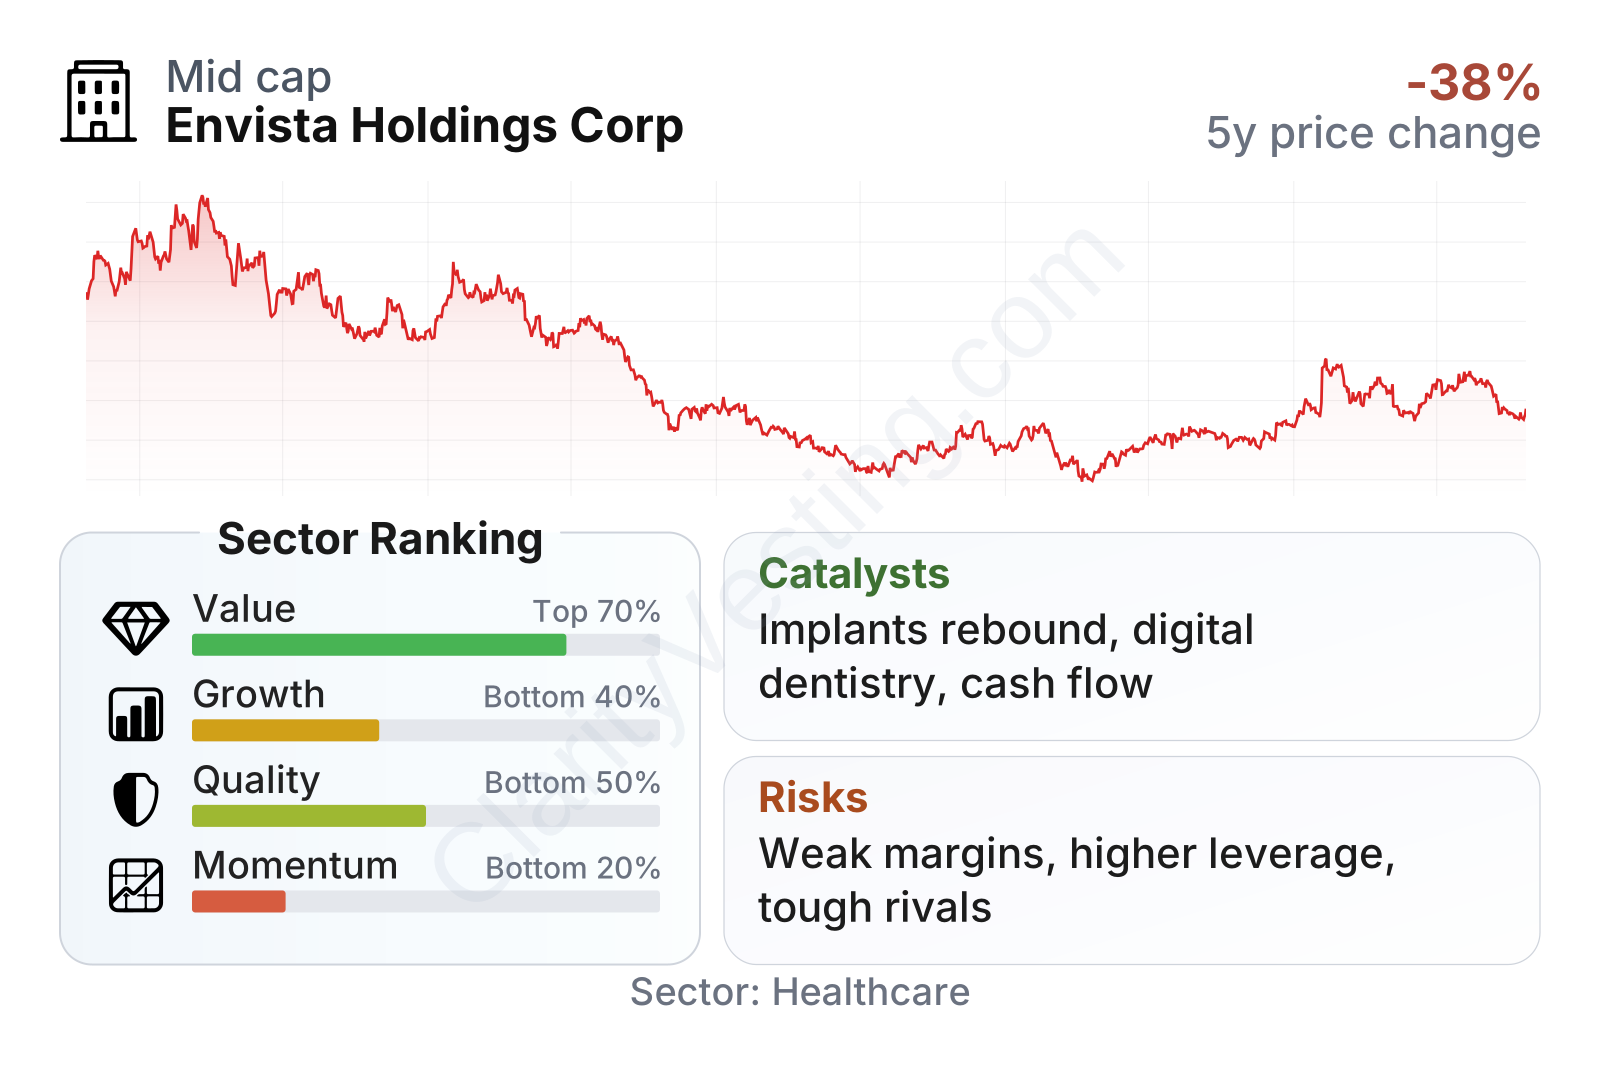
Envista is a mid-sized healthcare equipment company with a market value in the mid-single-digit billions of dollars and a stock volatility slightly below the broader market. The overall profile is mixed. Valuation measures are not uniformly cheap, but cash-flow-based measures look stronger than the sector median. Quality metrics are around the middle of the pack, growth ranks below average, and recent share-price momentum remains weak over longer periods despite a recovery from the lows.
The most encouraging point in the metrics table is cash generation: free cash flow yield stands above the sector median, and EBIT relative to enterprise value is also notably stronger than the industry midpoint. The weakest area is growth, where multi-year trends in earnings, margins, and free cash flow remain softer than many healthcare peers.
Growth
Dental care is generally an attractive long-term market because it benefits from several durable trends: aging populations keeping teeth longer, rising interest in implants and orthodontics, more digital workflows inside clinics, and growing demand for aesthetic dentistry. Envista is positioned in each of these themes, especially through implants, orthodontics, and imaging. That places it in a sector with genuine structural support rather than a purely cyclical niche.
That said, dentistry is not immune to economic pressure. Basic procedures tend to be resilient, but elective treatments and equipment purchases can be delayed when consumers and clinics become cautious. This is one reason Envista’s growth has looked uneven in recent years.
Revenue growth has clearly improved after a soft stretch in 2023 and much of 2024. The more recent pattern points to a return to positive momentum, including double-digit year-over-year growth at the end of 2025 and continued growth into 2026, though the pace has moderated from the strongest rebound period. That is a healthier picture than the company showed during its downturn, but it still does not establish Envista as a consistently fast grower.
Management’s strategy remains logical for future expansion. The company is leaning on specialty categories where technology, brand reputation, and clinical training matter more than in basic supplies. Digital imaging, workflow integration, implants, and orthodontics can create better pricing power and deeper customer relationships than purely commoditized dental products. Envista has also continued product launches and commercial initiatives designed to rebuild momentum after the disruptions of the last few years.
Free cash flow has held up better than accounting earnings. Even with some recent moderation, the business continues to produce more than $200 million in trailing cash flow, which supports debt servicing, restructuring flexibility, and ongoing investment in product development. For a long-term view, that is important because it suggests the company’s underlying economics are steadier than headline net income alone would imply.
A notable recent opportunity is the broader recovery in dental procedure volumes and capital spending after a period of weakness, combined with continued adoption of digital and specialty solutions. If Envista can translate that into stronger implant, orthodontic, and imaging sales while keeping costs under control, growth could look materially better than the company’s five-year averages.
Risks
This article is for informational purposes only and does not constitute financial advice. Some content is AI-generated. See Disclaimer


