Stock Analysis · Novartis AG (NVS)
Overview
Novartis AG is a large global pharmaceutical company focused on developing and selling prescription medicines. After reshaping its business in recent years, the group is now much more concentrated on innovative branded drugs rather than running a broad mix of pharmaceuticals, generics, and consumer health activities. Its products are used in major disease areas such as cardiovascular disease, immunology, neuroscience, cancer, and kidney disorders.
For a long-term reader, the business is relatively simple to understand: Novartis spends heavily on research, runs clinical trials, secures regulatory approvals, and then markets patented medicines worldwide. If a drug proves effective and commercially important, it can produce many years of high-margin revenue. This creates a business model with strong profitability and cash generation, but also with meaningful dependence on a limited number of key medicines.
Based on the company’s recent annual reporting structure, Novartis generates essentially all of its revenue from innovative medicines. Within that, the largest product drivers come from a handful of blockbuster drugs.
- Entresto: approximately 15% of group revenue in 2025; a heart failure medicine and one of Novartis’ most important growth products.
- Cosentyx: approximately 11%; an immunology medicine used in conditions such as psoriasis and related inflammatory diseases.
- Kisqali: approximately 6%; a breast cancer treatment that has become one of the company’s main oncology growth engines.
- Kesimpta: approximately 5%; a treatment for multiple sclerosis and a key neuroscience asset.
- Leqvio: approximately 1% to 2%; a cholesterol-lowering medicine with long-term potential, especially if adoption broadens in primary care.
- Pluvicto: approximately 2%; a radioligand therapy for prostate cancer and a strategic product in a high-interest treatment platform.
- Scemblix: approximately 2%; a leukemia medicine that strengthens the oncology portfolio.
- Other innovative medicines: approximately 58% to 59%; this includes a broad collection of established and growth products across Novartis’ core therapeutic areas.
The revenue mix shows an important feature of the company: Novartis is diversified across multiple medicines, but not so diversified that individual product success stops mattering. The largest brands still have a major influence on growth, patent exposure, and market sentiment.
Over the past several years, Novartis’ revenue base has expanded from the low-$40 billion range to the mid-$50 billion range, while operating income has improved meaningfully. Research spending remains very large, generally around $10 billion to $11 billion annually, which is typical for a major pharmaceutical company trying to sustain a deep product pipeline. Selling and administrative costs are also substantial, but the overall picture is that rising sales have translated into stronger operating earnings.
Key Figures
| Metric | Value | Sector ⓘ |
|---|---|---|
| Date | Oct 24, 2026 | |
| Context | ||
| Sector | Healthcare | |
| Industry | Drug Manufacturers - General | |
| Market Cap ⓘ | $292.58B | |
| Beta ⓘ | 0.47 | |
Value (Cheapness) | ||
| P/E Ratio ⓘ | 23.25 | 25.42 |
| P/B Ratio ⓘ | 7.27 | 3.08 |
| FCF Yield ⓘ | 5.41% | 3.12% |
| Dividend Yield ⓘ | 3.08% | 1.85% |
| EBIT / EV ⓘ | 5.39% | 0.56% |
| PEG ⓘ | 3.34 | |
Growth (Business expansion) | ||
| Revenue Growth ⓘ | 0.80% | 7.50% |
| RPS Growth (5Y CAGR) ⓘ | 9.56% | 8.60% |
| EPS Growth (5Y CAGR) ⓘ | -10.37% | -17.73% |
| BVPS Growth (5Y CAGR) ⓘ | -5.93% | 3.72% |
| Margin Growth (5Y Trend) ⓘ | -25.40% | -0.57% |
| FCF Growth (5Y CAGR) ⓘ | 9.95% | 0.96% |
| DPS Growth (5Y CAGR) ⓘ | 5.37% | 6.69% |
Quality (Business durability) | ||
| ROIC (Latest) ⓘ | 17.01% | 3.17% |
| ROA (Latest) ⓘ | 11.13% | 2.98% |
| ROIC (5Y Median) ⓘ | 17.72% | 4.56% |
| ROA (5Y Median) ⓘ | 12.91% | 1.87% |
| Net Debt / EBIT (Latest) ⓘ | 2.45 | 1.34 |
| Net Debt / EBIT (5Y Median) ⓘ | 1.35 | 1.86 |
| Net Debt / EBITDA (Latest) ⓘ | 1.86 | 1.00 |
| Net Debt / Assets ⓘ | 33.92% | 5.06% |
| EBITDA / Interest ⓘ | 16.01 | 9.55 |
| Operating Margin (Latest) ⓘ | 30.41% | 9.25% |
| Operating Margin (5Y Median) ⓘ | 28.32% | 7.33% |
| Debt to Equity (Latest) ⓘ | 117.99% | 26.68% |
| Profit Margin (Latest) ⓘ | 22.50% | 3.34% |
| Free Cash Flow (Latest) ⓘ | $15.82B | |
Momentum (Price trend) | ||
| 3Y Return ⓘ | +83.05% | +51.61% |
| 12M Return (excl. last month) ⓘ | +18.01% | +19.90% |
| 6M Return ⓘ | +6.08% | +10.10% |
| Price vs. 200-Day MA ⓘ | +3.90% | +6.44% |
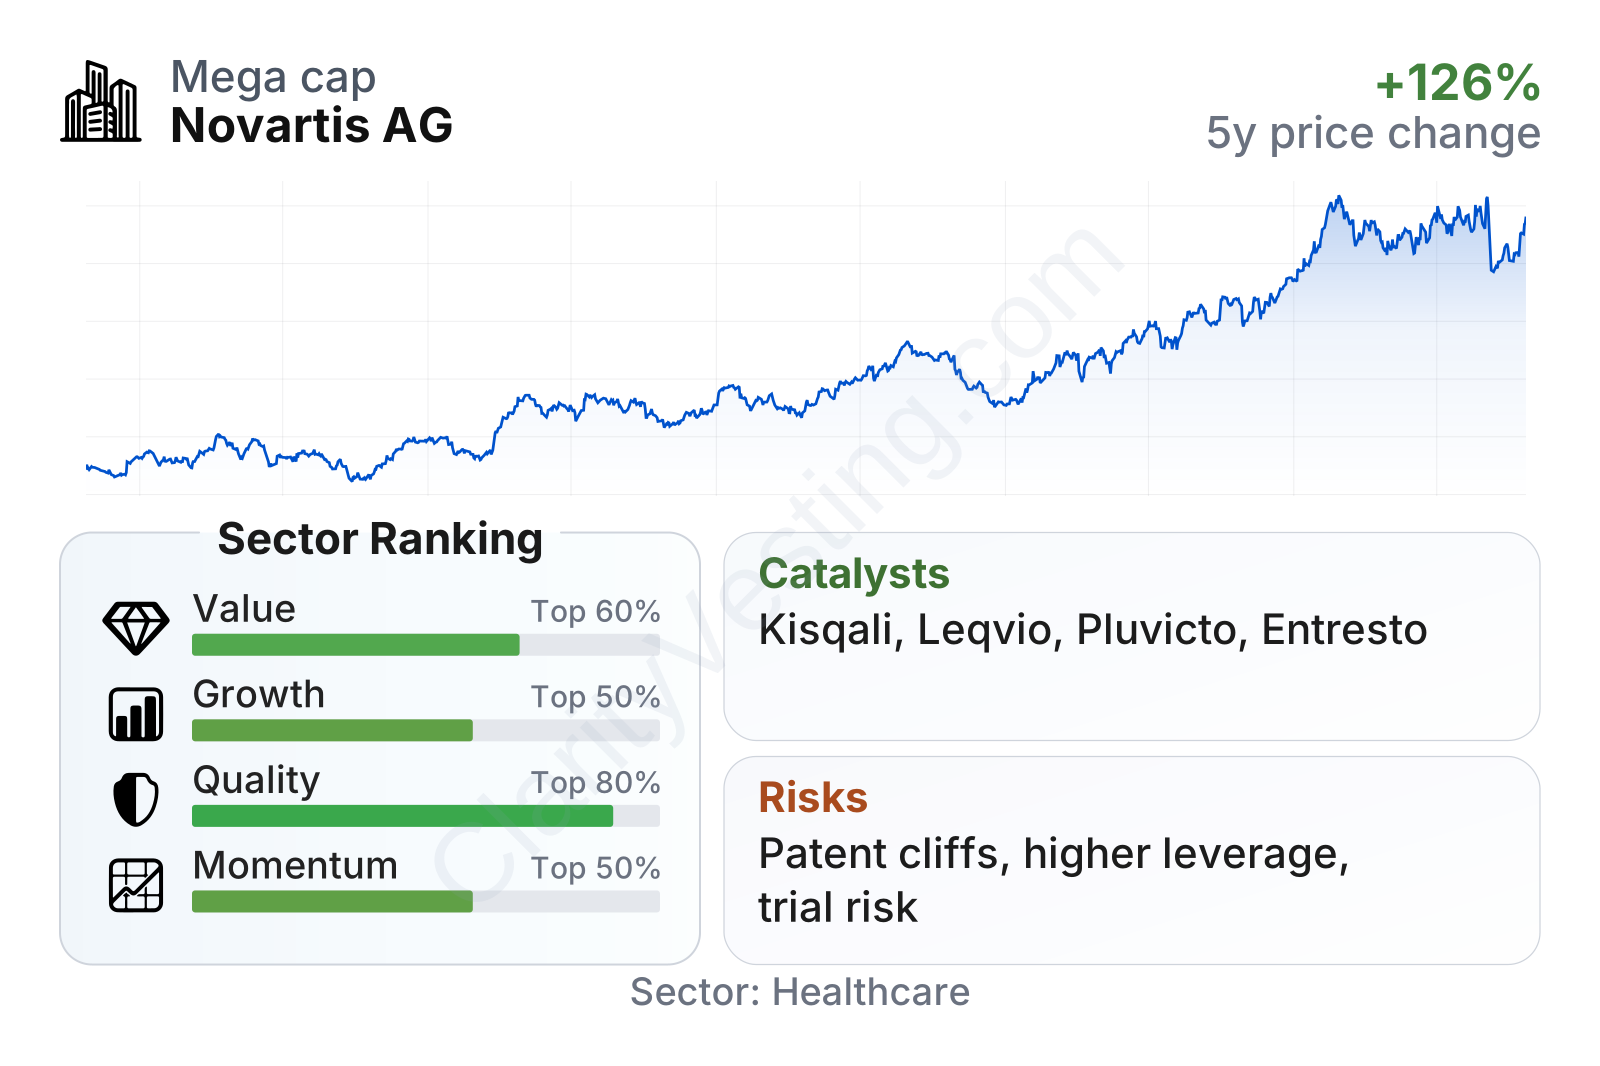
Novartis stands out as a very large healthcare company with relatively low share-price volatility, reflected in a beta well below 1. Its quality profile is strong: returns on capital and asset profitability are far above the sector median, while operating and net margins are also notably stronger than many peers. On value metrics, the picture is mixed but generally constructive: the earnings multiple sits below the sector median, and cash-flow-based measures look stronger than average, although the price-to-book ratio is elevated. Growth indicators are more balanced, with strong multi-year cash flow and revenue-per-share trends but softer recent revenue growth and some pressure in margin trends versus the company’s own peak levels.
Growth
The pharmaceutical sector remains structurally attractive for long-term analysis. Demand is supported by aging populations, rising rates of chronic disease, broader diagnosis, and continued medical innovation. Within that setting, Novartis is positioned in some of the industry’s most commercially important categories, including cardiovascular care, immunology, oncology, and neuroscience. These are large markets where successful products can remain relevant for years.
Novartis’ strategy also appears coherent. The company has simplified itself around innovative medicines and has been directing capital toward areas where it believes it can build leadership rather than spreading resources across unrelated healthcare segments. That sharper focus matters because scale alone is not enough in pharmaceuticals; what matters is whether research spending turns into differentiated products with pricing power and long commercial runways.
Recent revenue growth has not been perfectly smooth on a quarter-to-quarter basis, which is normal in this industry because comparisons can be affected by launches, pricing, currency, and timing. Still, the broader pattern since 2023 has been one of recovery and expansion, with particularly strong growth in 2024 and much of 2025 before moderating in the latest comparisons. That suggests Novartis has already benefited from newer products, but it also shows that sustaining a high growth rate gets harder as the revenue base becomes larger.
Cash generation is one of the company’s clearest strengths. Free cash flow has trended upward over the last several years and now sits in the mid-teens of billions of dollars on a trailing basis. For a research-driven company, that is important because it provides room to fund clinical development, bolt-on acquisitions, manufacturing capacity, dividends, and debt servicing without depending heavily on new financing.
The main growth catalysts come from execution on the newer medicine portfolio. Kisqali has become increasingly important after stronger positioning in breast cancer. Kesimpta continues to support the neuroscience franchise. Leqvio remains one of the more interesting long-range opportunities because its dosing schedule is differentiated, even though commercial ramp-up has taken time. Pluvicto and the broader radioligand platform are also meaningful because they could give Novartis a distinctive place in a specialized oncology niche that is drawing significant industry attention.
Recent company updates have also highlighted continued regulatory and clinical progress across key medicines and pipeline programs. For a business like Novartis, these developments matter more than short-term macroeconomic news. A positive trial readout, a label expansion, or stronger reimbursement support can materially increase the future earnings power of a single drug franchise.
Risks
This article is for informational purposes only and does not constitute financial advice. Some content is AI-generated. See Disclaimer


