Stock Analysis · Navigator Holdings Ltd (NVGS)
Overview
Navigator Holdings Ltd is a marine transportation company focused on moving liquefied gases by sea. Its fleet specializes in handysize gas carriers, which are smaller vessels designed to serve ports and trade routes that larger ships cannot easily reach. The company transports products such as liquefied petroleum gas, petrochemical gases, and ammonia, and it also has exposure to terminal infrastructure through its interest in an ethylene export marine terminal at Morgan’s Point in Texas.
In simple terms, Navigator sits in the middle of global energy and chemical supply chains. Producers, traders, and industrial customers rely on these ships to move gases that are difficult to store and transport. That gives the business a practical role: it is not drilling for oil or making chemicals, but providing the logistics needed to connect supply with demand.
The company’s revenue mainly comes from vessel operations, with a smaller contribution from its terminal and related services. Based on recent company disclosures, the revenue mix is approximately structured as follows:
- Seaborne transportation and vessel-related services: about 90% to 95% — charter hire and freight earned from transporting LPG, petrochemical gases, ammonia, and other liquefied gases.
- Terminal and infrastructure-related income: about 5% to 10% — mainly the company’s participation in the export terminal joint venture and associated marine export activity.
Within shipping activity, the cargo mix matters because petrochemical gases and ammonia can carry stronger rates than more commoditized LPG routes when vessel availability is tight. That means the company’s earnings are influenced not only by how many ships it has, but also by what those ships are carrying and under what type of charter.
The business has become much more profitable than it was a few years ago. Revenue has increased from a little above $400 million in 2021 to nearly $590 million in 2025, while operating income and net income improved sharply over the same period. The broad pattern is clear: stronger utilization, better pricing, and more efficient fleet deployment have lifted earnings power.
Over the last several years, the biggest visible change has been the jump in profitability. Sales have grown, but margins have improved even more, showing that recent gains are not only coming from volume. Interest expense remains meaningful, yet the business has moved from weak profitability in 2021 to a much healthier earnings profile.
Key Figures
| Metric | Value | Sector ⓘ |
|---|---|---|
| Date | Oct 17, 2026 | |
| Context | ||
| Sector | Energy | |
| Industry | Oil & Gas Midstream | |
| Market Cap ⓘ | $1.46B | |
| Beta ⓘ | 0.48 | |
Value (Cheapness) | ||
| P/E Ratio ⓘ | 11.00 | 15.44 |
| P/B Ratio ⓘ | 1.18 | 1.73 |
| FCF Yield ⓘ | 9.12% | 8.20% |
| Dividend Yield ⓘ | 1.18% | 3.59% |
| EBIT / EV ⓘ | 9.89% | 7.46% |
| PEG ⓘ | 4.42 | |
Growth (Business expansion) | ||
| Revenue Growth ⓘ | 29.50% | 26.90% |
| RPS Growth (5Y CAGR) ⓘ | 8.24% | 6.90% |
| EPS Growth (5Y CAGR) ⓘ | 34.06% | -15.73% |
| BVPS Growth (5Y CAGR) ⓘ | 0.53% | 6.07% |
| Margin Growth (5Y Trend) ⓘ | 29.60% | 0.58% |
| FCF Growth (5Y CAGR) ⓘ | -8.60% | 1.86% |
| DPS Growth (5Y CAGR) ⓘ | N/A | 16.79% |
Quality (Business durability) | ||
| ROIC (Latest) ⓘ | 9.62% | 11.40% |
| ROA (Latest) ⓘ | 6.06% | 6.06% |
| ROIC (5Y Median) ⓘ | 6.63% | 10.30% |
| ROA (5Y Median) ⓘ | 3.83% | 5.42% |
| Net Debt / EBIT (Latest) ⓘ | 3.11 | 1.64 |
| Net Debt / EBIT (5Y Median) ⓘ | 4.33 | 1.83 |
| Net Debt / EBITDA (Latest) ⓘ | 1.93 | 1.08 |
| Net Debt / Assets ⓘ | 28.11% | 17.29% |
| EBITDA / Interest ⓘ | 6.25 | 9.64 |
| Operating Margin (Latest) ⓘ | 34.09% | 16.27% |
| Operating Margin (5Y Median) ⓘ | 24.30% | 20.39% |
| Debt to Equity (Latest) ⓘ | 74.76% | 54.76% |
| Profit Margin (Latest) ⓘ | 22.80% | 8.82% |
| Free Cash Flow (Latest) ⓘ | $133.25M | |
Momentum (Price trend) | ||
| 3Y Return ⓘ | +67.06% | +67.38% |
| 12M Return (excl. last month) ⓘ | +44.13% | +49.19% |
| 6M Return ⓘ | +14.34% | +7.07% |
| Price vs. 200-Day MA ⓘ | +9.46% | +9.56% |
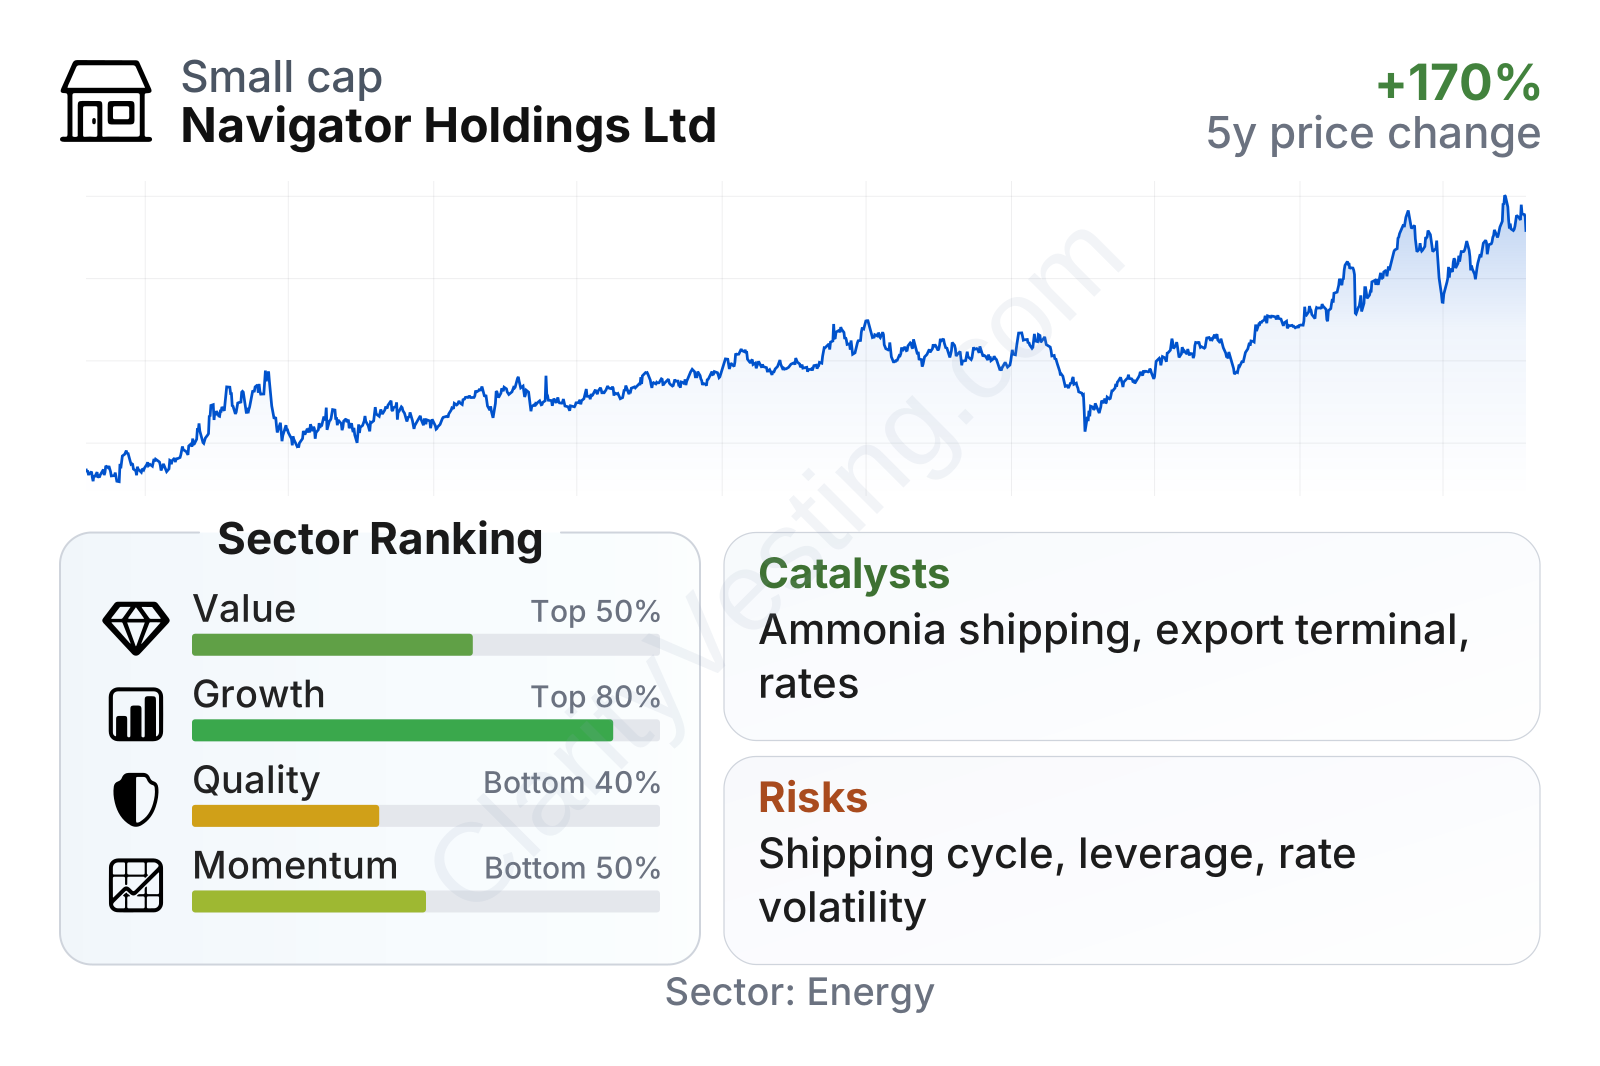
Navigator is a mid-sized company in its sector, and the current metrics present a mixed but generally constructive profile. Valuation measures sit around the better half of the sector, helped by a price-to-earnings ratio near 11 and a price-to-book ratio below the sector median. Growth measures are strong, especially over five years for earnings and margin expansion, while quality measures are held back by leverage that remains higher than many peers. Share price performance has also been favorable, with recent momentum stronger than the broader sector trend.
The stock chart shows a volatile but upward path over the last several years. After a sharp pullback in 2025, the shares recovered strongly into 2026 and moved to new highs for the period shown. That pattern fits a company tied to shipping markets: sentiment can swing, but improving fundamentals have recently carried more weight than short-term setbacks.
Growth
Navigator operates in a sector with long-term relevance rather than a fast-changing technology market. Demand for liquefied gas shipping is supported by global LPG trade, petrochemical exports, and rising interest in ammonia as a lower-carbon fuel and hydrogen carrier. The company’s niche matters here: handysize gas carriers are flexible assets, and flexibility can be valuable in specialized markets where port access, parcel size, and cargo complexity create barriers.
Its strategy appears coherent for future expansion. Navigator has continued to focus on specialized gas shipping, where fleet know-how and customer relationships matter more than simple scale. The company also has exposure to ammonia and petrochemical gas transportation, two areas that could benefit from industrial investment and energy transition spending. Ammonia, in particular, is attracting attention both as a traded commodity and as a possible marine fuel, which could increase shipping demand across parts of the value chain.
Revenue growth has not been smooth quarter to quarter, which is normal in shipping, but the broader direction remains positive. The latest year-over-year reading is strong, and the longer-term trend still points to a larger and more profitable business than it was a few years ago. Five-year revenue per share growth is also ahead of the sector median, which supports the view that expansion has not been purely temporary.
Cash generation has been uneven, but recent levels are healthy. Free cash flow moved from negative territory in 2023 to a much stronger position afterward, and the trailing figure remains solid. For a vessel owner, this is important because cash flow funds debt reduction, dividends, fleet upgrades, and potential new investments without relying entirely on capital markets.
A notable recent opportunity is the company’s positioning in ammonia transportation and export infrastructure. Navigator’s terminal interest and specialized fleet give it a practical link to U.S. gas and petrochemical export growth. If ammonia trade scales further, the company already has a foothold instead of needing to build one from scratch. In that sense, the strongest catalysts are not speculative inventions but extensions of capabilities it already operates.
Risks
This article is for informational purposes only and does not constitute financial advice. Some content is AI-generated. See Disclaimer


