Stock Analysis · Nuvation Bio Inc (NUVB)
Overview
Nuvation Bio Inc is a biotechnology company focused on developing cancer medicines. Its business is still in the transition from a pure research-stage company to one with commercial activity. That matters for long-term analysis because most of the company’s value still depends on whether its drug pipeline can win approvals, gain adoption, and eventually support durable sales.
The company’s current commercial focus is centered on IBTROZI (taletrectinib), a targeted therapy for certain lung cancer patients with ROS1-positive non-small cell lung cancer. In recent company disclosures, Nuvation Bio has also highlighted a broader oncology pipeline that includes additional internal programs and combination strategies, but the economic profile remains heavily tied to the success of this lead asset.
Revenue is still concentrated and relatively early-stage. Based on recent annual reporting and the company’s financial profile, the main sources of revenue appear to be:
- Product revenue from IBTROZI / taletrectinib-related commercialization: approximately 85% to 100%. This represents sales tied to the company’s first commercial oncology product activity and is now the core operating revenue stream.
- Collaboration, licensing, or other operating revenue: approximately 0% to 15%. This can include milestone-related, partnership-related, or other smaller operating items when recognized.
- Interest and other non-operating income: present at times, but not a primary business revenue source and usually not meaningful for understanding the core business.
The cost structure is still dominated by drug development and launch spending rather than mature operating profits. Research and development has historically been the largest use of cash, and selling, general, and administrative expense increased as the company prepared for commercialization. The broad pattern is typical for a biotech moving from clinical development into an initial launch phase: revenue has started to appear, but expenses still run far ahead of sales.
The visual flow of the business shows a sharp shift from years with virtually no revenue to a more commercial profile, but it also shows that operating losses remain substantial because development and launch costs are still much larger than gross profit.
Key Figures
| Metric | Value | Sector ⓘ |
|---|---|---|
| Date | Oct 03, 2026 | |
| Context | ||
| Sector | Healthcare | |
| Industry | Biotechnology | |
| Market Cap ⓘ | $1.97B | |
| Beta ⓘ | 1.53 | |
Value (Cheapness) | ||
| P/E Ratio ⓘ | N/A | 24.06 |
| P/B Ratio ⓘ | 7.64 | 3.08 |
| FCF Yield ⓘ | -4.21% | 3.07% |
| Dividend Yield ⓘ | N/A | 2.05% |
| EBIT / EV ⓘ | -7.45% | 0.63% |
| PEG ⓘ | N/A | |
Growth (Business expansion) | ||
| Revenue Growth ⓘ | 555.60% | 7.50% |
| RPS Growth (5Y CAGR) ⓘ | N/A | 8.70% |
| EPS Growth (5Y CAGR) ⓘ | -25.87% | -18.20% |
| BVPS Growth (5Y CAGR) ⓘ | -30.19% | 3.95% |
| Margin Growth (5Y Trend) ⓘ | N/A | -0.58% |
| FCF Growth (5Y CAGR) ⓘ | N/A | 0.88% |
| DPS Growth (5Y CAGR) ⓘ | N/A | 6.80% |
Quality (Business durability) | ||
| ROIC (Latest) ⓘ | -25.00% | 3.29% |
| ROA (Latest) ⓘ | -22.26% | 3.02% |
| ROIC (5Y Median) ⓘ | -15.25% | 4.75% |
| ROA (5Y Median) ⓘ | -17.41% | 1.93% |
| Net Debt / EBIT (Latest) ⓘ | N/A | 1.33 |
| Net Debt / EBIT (5Y Median) ⓘ | N/A | 1.83 |
| Net Debt / EBITDA (Latest) ⓘ | N/A | 0.99 |
| Net Debt / Assets ⓘ | -0.87% | 5.33% |
| EBITDA / Interest ⓘ | N/A | 9.63 |
| Operating Margin (Latest) ⓘ | -76.04% | 9.25% |
| Operating Margin (5Y Median) ⓘ | N/A | 7.80% |
| Debt to Equity (Latest) ⓘ | 99.32% | 28.99% |
| Profit Margin (Latest) ⓘ | -88.19% | 3.60% |
| Free Cash Flow (Latest) ⓘ | -$82.72M | |
Momentum (Price trend) | ||
| 3Y Return ⓘ | +341.27% | +37.48% |
| 12M Return (excl. last month) ⓘ | +123.57% | +20.85% |
| 6M Return ⓘ | +23.28% | +9.73% |
| Price vs. 200-Day MA ⓘ | -4.04% | +4.69% |
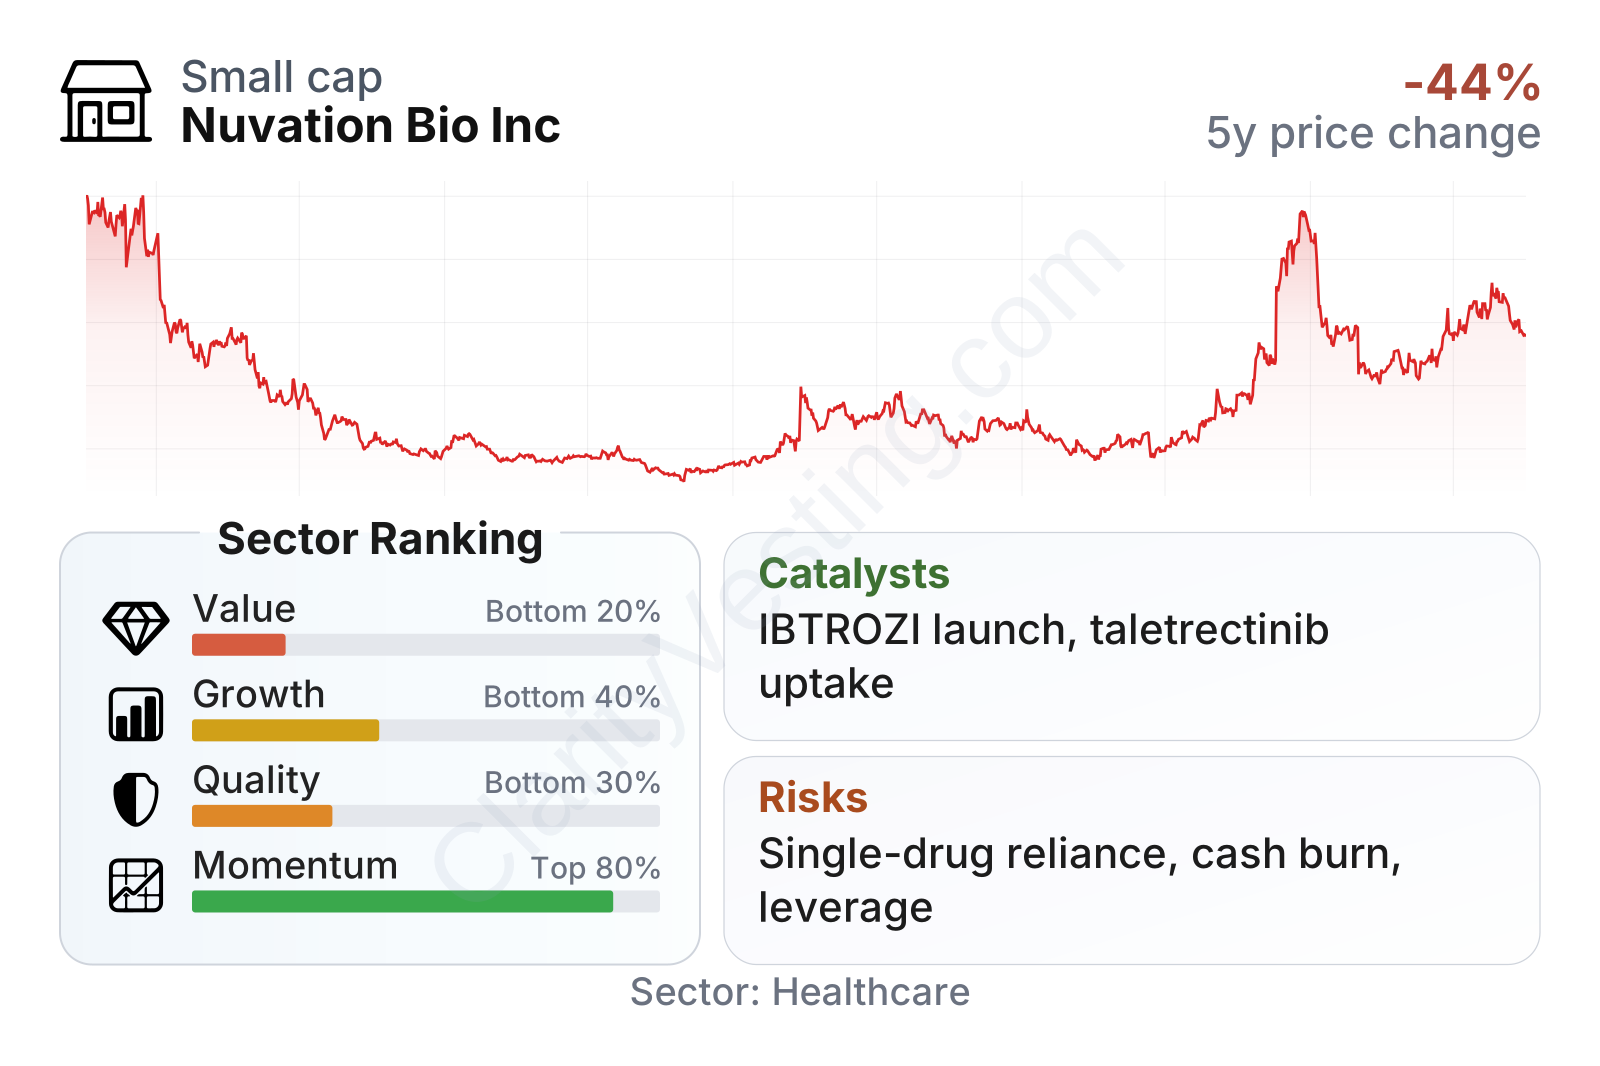
Nuvation Bio is a mid-sized biotechnology company by market value, but financially it still looks like an early commercial-stage business rather than an established profitable drug maker. The factor breakdown is mixed: valuation, quality, and growth rank in the lower part of the healthcare sector, while market momentum is much stronger. That combination usually means the market is reacting to clinical or regulatory progress faster than the income statement is improving.
The balance sheet and income statement also show why the stock can be volatile. Beta is above 1.5, which suggests larger price swings than the broader market. At the same time, traditional valuation measures look demanding because the company is still unprofitable, free cash flow remains negative, and the price-to-book ratio sits above the sector median.
Growth
Biotechnology remains a growth sector over the long run, especially in oncology, where targeted therapies and precision medicine continue to attract funding, partnerships, and acquisition interest. Lung cancer is a major treatment market, and narrowly defined molecular subgroups such as ROS1-positive disease can still support meaningful commercial opportunities when a drug shows strong clinical performance and a differentiated safety or efficacy profile.
Nuvation Bio’s strategy makes sense in that context. Rather than trying to compete broadly across many cancer categories at once, it has centered the business around targeted oncology assets where successful approval can create a clearer path to commercialization. The company’s future growth is therefore less about broad diversification today and more about converting one lead program into a platform for credibility, revenue, and potentially further label expansion or pipeline advancement.
Revenue growth has been strong on a year-over-year basis, but that needs context. The percentages are amplified by the fact that Nuvation Bio is growing from a very small base. In other words, the direction is clearly positive, yet the business is still far from the scale needed to absorb its full operating cost structure.
A major catalyst is the regulatory and launch trajectory of taletrectinib. Company announcements in 2026 emphasized continued progress around commercialization and physician awareness following approval activity. For a company of this size, the launch curve of one drug can materially change financial expectations, especially if uptake is stronger than expected or if the medicine demonstrates staying power against competing targeted therapies.
There is also strategic value in execution beyond the first prescription numbers. If the company can prove it can launch effectively, negotiate access, and generate real-world physician adoption, that can improve confidence in the rest of the pipeline. In biotech, commercial credibility often matters almost as much as scientific credibility once the first product reaches the market.
Free cash flow remains negative, although the recent path has been less severe than the peak burn seen around the heavy investment period. That suggests the company may be moving past the most intense spending spike, but it still has not reached self-funding territory. Long-term progress will depend on whether product revenue can scale faster than operating expenses over the next several reporting periods.
Risks
This article is for informational purposes only and does not constitute financial advice. Some content is AI-generated. See Disclaimer


