Stock Analysis · Netstreit Corp (NTST)
Overview
NETSTREIT Corp is a retail-focused real estate investment trust, or REIT. In simple terms, it owns commercial properties and collects rent from tenants. The company concentrates on single-tenant net lease properties, which usually means the tenant, not the landlord, is responsible for many property-level costs such as taxes, insurance, and maintenance. That model can create relatively predictable rental income when the properties are occupied by financially solid tenants.
The portfolio is built around defensive retail categories and service-oriented businesses that tend to stay relevant even when online shopping grows. Based on company disclosures, NETSTREIT emphasizes tenants in areas such as convenience retail, automotive services, pharmacies, home improvement, grocery-related uses, and quick-service restaurants. It also highlights a focus on properties leased to tenants with investment-grade credit profiles or similar characteristics, which is meant to reduce cash flow volatility.
Its revenue comes overwhelmingly from rental income generated by owned properties. For a REIT like NETSTREIT, the main economic drivers are rent collections, contractual rent increases, and acquisitions that add new properties to the portfolio. A simple breakdown looks like this:
- Rental revenue from owned retail properties: approximately 95% to 100% of total revenue. This includes base rent paid by tenants under long-term lease agreements.
- Other real estate-related income: a small share of revenue. This can include items such as lease-related reimbursements, fee income, or other property-level amounts when disclosed.
Over the last several years, the business has expanded steadily. Revenue rose from roughly $59 million in 2021 to about $195 million in 2025, showing that acquisitions and portfolio growth have been the main engine of scale. At the same time, interest expense also increased materially, which is important because REIT expansion often depends on debt and equity funding.
The overall pattern is clear: rental income has grown strongly, operating profit has improved over time, but financing costs have also climbed as the company expanded. That combination helps explain why property-level growth has looked healthier than bottom-line earnings alone might suggest.
Key Figures
| Metric | Value | Sector ⓘ |
|---|---|---|
| Date | Oct 17, 2026 | |
| Context | ||
| Sector | Real Estate | |
| Industry | REIT - Retail | |
| Market Cap ⓘ | $1.75B | |
| Beta ⓘ | 0.80 | |
Value (Cheapness) | ||
| P/E Ratio ⓘ | 122.79 | 17.38 |
| P/B Ratio ⓘ | 1.14 | 0.85 |
| FCF Yield ⓘ | -20.64% | 7.38% |
| Dividend Yield ⓘ | 5.00% | 4.85% |
| EBIT / EV ⓘ | 2.24% | 3.78% |
| PEG ⓘ | N/A | |
Growth (Business expansion) | ||
| Revenue Growth ⓘ | 26.90% | 5.30% |
| RPS Growth (5Y CAGR) ⓘ | 10.93% | 6.02% |
| EPS Growth (5Y CAGR) ⓘ | 27.29% | -11.37% |
| BVPS Growth (5Y CAGR) ⓘ | -4.02% | 0.45% |
| Margin Growth (5Y Trend) ⓘ | 21.61% | -0.22% |
| FCF Growth (5Y CAGR) ⓘ | 37.36% | 5.40% |
| DPS Growth (5Y CAGR) ⓘ | 0.88% | 5.02% |
Quality (Business durability) | ||
| ROIC (Latest) ⓘ | 2.71% | 5.69% |
| ROE (Latest) ⓘ | 0.97% | 7.56% |
| ROA (Latest) ⓘ | 0.51% | 2.85% |
| ROIC (5Y Median) ⓘ | 1.56% | 4.22% |
| ROE (5Y Median) ⓘ | 0.50% | 6.03% |
| ROA (5Y Median) ⓘ | 0.34% | 2.44% |
| Net Debt / EBIT (Latest) ⓘ | 19.15 | 7.59 |
| Net Debt / EBIT (5Y Median) ⓘ | 22.17 | 8.40 |
| Net Debt / EBITDA (Latest) ⓘ | 8.36 | 5.27 |
| Net Debt / Assets ⓘ | 46.07% | 37.76% |
| EBITDA / Interest ⓘ | 2.77 | 4.10 |
| Operating Margin (Latest) ⓘ | 33.78% | 35.29% |
| Operating Margin (5Y Median) ⓘ | 22.43% | 37.31% |
| Debt to Equity (Latest) ⓘ | 90.23% | 88.87% |
| Profit Margin (Latest) ⓘ | 6.35% | 19.61% |
| Free Cash Flow (Latest) ⓘ | -$361.70M | |
Momentum (Price trend) | ||
| 3Y Return ⓘ | +34.32% | +30.75% |
| 12M Return (excl. last month) ⓘ | +10.35% | +4.36% |
| 6M Return ⓘ | -12.36% | -2.52% |
| Price vs. 200-Day MA ⓘ | -11.26% | -2.34% |
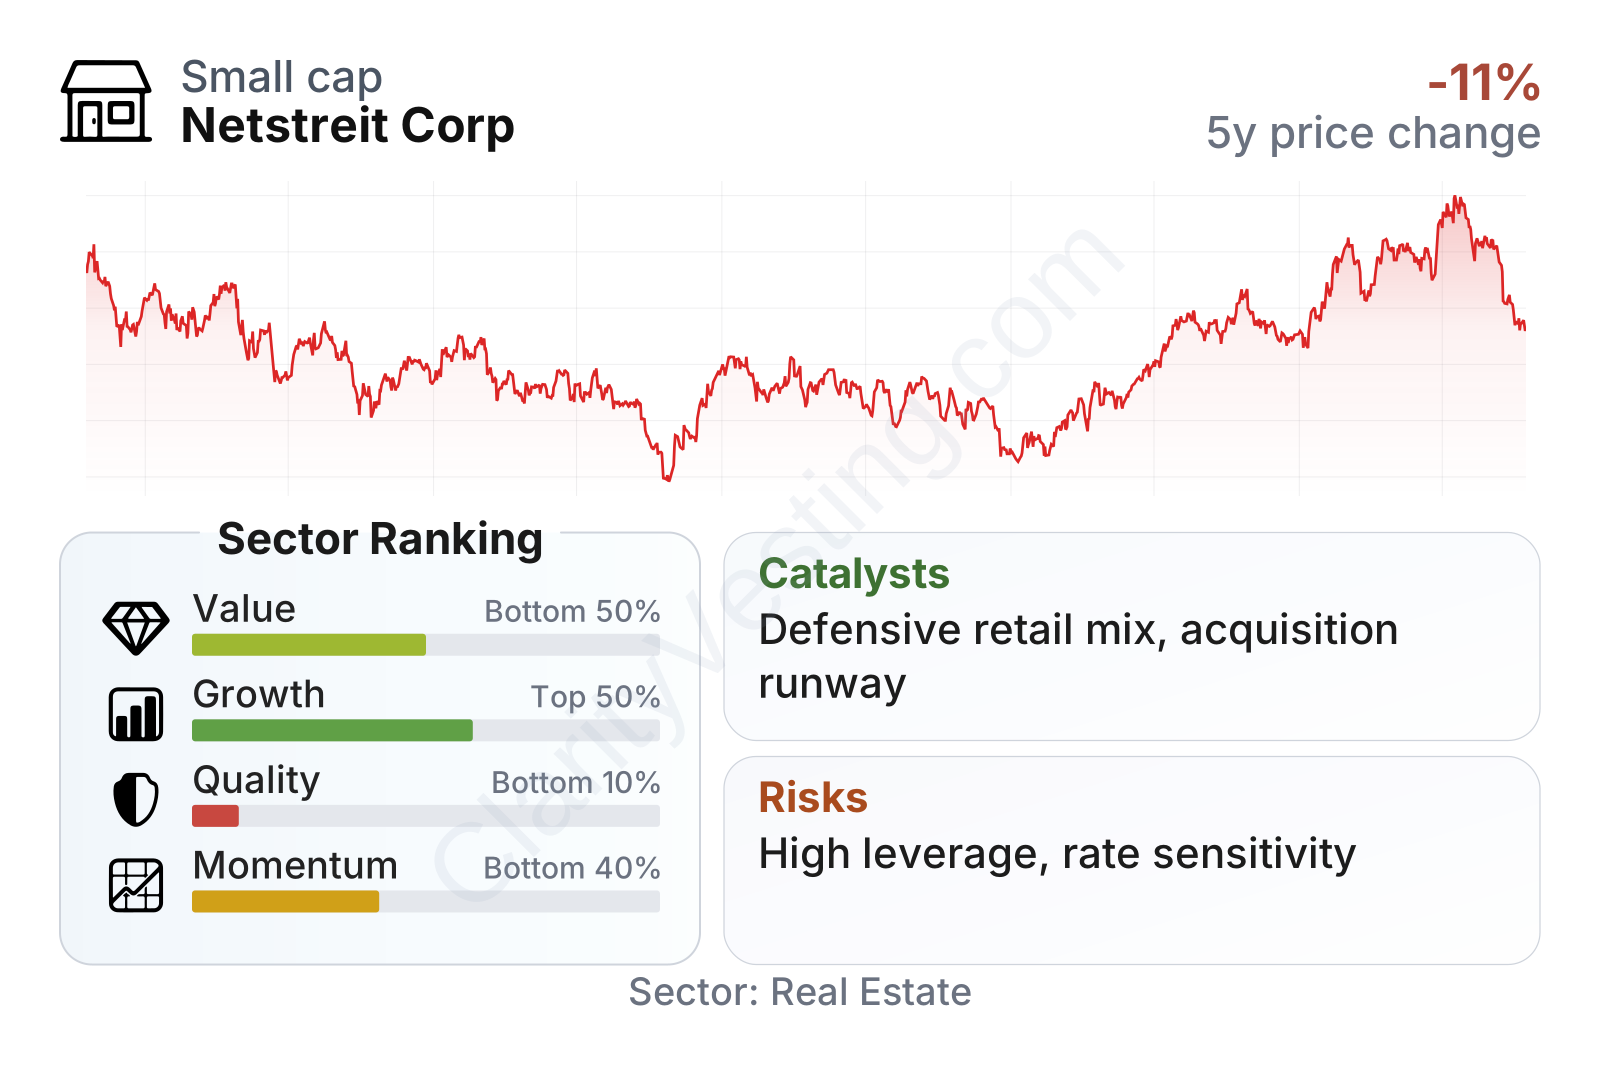
NETSTREIT is a mid-sized retail REIT with a market value around $1.8 billion and a beta below 1, which suggests the shares have tended to move somewhat less than the broader market. The table shows a mixed profile. Growth metrics are strong in several areas, especially recent revenue growth and the longer-term increase in revenue per share. Dividend yield is close to the sector median, but value metrics look less favorable, with a high earnings multiple and weaker operating yield measures. Quality metrics are the weakest part of the picture, mainly because returns on assets and equity are low and leverage is above many peers.
The share price history also shows that the stock has recovered well from earlier weakness tied to higher interest rates and REIT pressure. Even so, shorter-term momentum has softened compared with the stronger move seen over the prior year.
Growth
NETSTREIT operates in a part of real estate that still has room for expansion. Net lease retail remains attractive because it offers long lease terms, steady rent collection, and a property format that can be scaled through acquisitions. The sector is not a high-growth technology market, but it can grow consistently when a REIT has access to capital and buys properties at yields that exceed its funding cost.
The company’s strategy makes sense for long-term expansion. Management has centered the portfolio on necessity-oriented and service-based retail, where tenants are less exposed to pure e-commerce disruption than many traditional store formats. That does not eliminate risk, but it does improve the odds that locations remain useful over long periods. In addition, a focus on credit quality and geographic diversification can support resilience when specific chains or local markets weaken.
Revenue per share has moved upward at a healthy pace over the last five years, which matters because it shows growth has not come only from issuing more shares. On a per-share basis, the business has still been getting larger, a positive sign for a REIT that regularly uses external capital to acquire properties.
The dividend per share has been relatively stable, with only modest growth over the period. That suggests management has prioritized balance sheet flexibility and portfolio expansion over aggressive dividend increases. For a retail REIT, that can be a sensible stance when interest rates are elevated and acquisition funding costs are less favorable than they were a few years ago.
A meaningful catalyst is the continued availability of acquisition opportunities in fragmented net lease real estate. Many properties are still owned by private investors or operators, leaving room for public REITs to consolidate assets. If financing conditions improve, NETSTREIT could have a better spread between acquisition yields and capital costs, which would make future deals more accretive.
Recent company updates have continued to emphasize portfolio growth, disciplined capital allocation, and tenant quality. The most important opportunity is not a single headline event but the company’s ability to keep expanding in defensive retail categories while preserving occupancy and rent collection. In a more stable rate environment, that model becomes easier to execute.
Risks
This article is for informational purposes only and does not constitute financial advice. Some content is AI-generated. See Disclaimer


