Stock Analysis · Bank of N.T. Butterfield & Son Ltd (NTB)
Overview
Bank of N.T. Butterfield & Son Ltd is a long-established bank focused on small, affluent island and international financial markets. Its core footprint includes Bermuda and the Cayman Islands, with additional operations in the Channel Islands and the U.K. The business is centered on traditional banking, wealth management, trust, and specialized lending tied to high-net-worth clients, businesses, and institutional customers.
Unlike large U.S. universal banks, Butterfield operates in niche jurisdictions where scale, local relationships, and regulatory know-how matter a great deal. That makes the company less dependent on broad mass-market banking and more exposed to fee-rich services and high-quality deposit franchises in offshore financial centers.
Based on recent annual disclosures, revenue is mainly generated from the following sources:
- Net interest income: about 70% to 75% of total revenue. This is the spread between what the bank earns on loans, cash, and securities and what it pays on deposits and other funding.
- Banking fees and foreign exchange: about 10% to 15%. This includes account-related fees, payments activity, card services, and currency transactions.
- Trust and asset management fees: about 8% to 12%. This comes from wealth management, fiduciary services, custody, and administration for private and institutional clients.
- Other non-interest income: about 3% to 7%. This generally includes treasury-related items and other service revenue.
That mix matters because it shows Butterfield is still primarily a spread-based bank, but with a meaningful layer of recurring fee income that can soften swings in lending and interest-rate conditions.
The multi-year income profile also shows a business that expanded revenue strongly from 2021 through 2024, with earnings staying robust even as funding costs rose. Operating discipline has remained solid, and profitability has held up better than many banks despite a more expensive deposit environment.
Over the last several years, revenue has risen materially while operating expenses increased much more slowly. Net income has remained strong even after a sharp rise in interest expense, which suggests the bank’s deposit base and pricing power have absorbed a tougher rate backdrop relatively well.
Key Figures
| Metric | Value | Sector ⓘ |
|---|---|---|
| Date | Oct 24, 2026 | |
| Context | ||
| Sector | Financial Services | |
| Industry | Banks - Diversified | |
| Market Cap ⓘ | $2.34B | |
| Beta ⓘ | 0.54 | |
Value (Cheapness) | ||
| P/E Ratio ⓘ | 10.45 | 12.46 |
| P/B Ratio ⓘ | 2.12 | 1.25 |
| FCF Yield ⓘ | 8.99% | 9.82% |
| Dividend Yield ⓘ | 3.36% | 2.94% |
| EBIT / EV ⓘ | N/A | 8.11% |
| PEG ⓘ | 1.96 | |
Growth (Business expansion) | ||
| Revenue Growth ⓘ | 8.20% | 9.10% |
| RPS Growth (5Y CAGR) ⓘ | 15.88% | 12.31% |
| EPS Growth (5Y CAGR) ⓘ | -8.29% | -6.97% |
| BVPS Growth (5Y CAGR) ⓘ | 8.28% | 5.02% |
| Margin Growth (5Y Trend) ⓘ | -2.03% | -4.00% |
| FCF Growth (5Y CAGR) ⓘ | 1.98% | 4.71% |
| DPS Growth (5Y CAGR) ⓘ | 1.16% | 8.92% |
Quality (Business durability) | ||
| ROIC (Latest) ⓘ | N/A | 9.18% |
| ROE (Latest) ⓘ | 20.79% | 13.93% |
| ROA (Latest) ⓘ | 1.65% | 1.57% |
| ROIC (5Y Median) ⓘ | 19.58% | 7.80% |
| ROE (5Y Median) ⓘ | 21.45% | 12.15% |
| ROA (5Y Median) ⓘ | 1.57% | 1.28% |
| Net Debt / EBIT (Latest) ⓘ | -5.32 | 1.02 |
| Net Debt / EBIT (5Y Median) ⓘ | -8.18 | 0.72 |
| Net Debt / EBITDA (Latest) ⓘ | -4.59 | 0.88 |
| Operating Margin (Latest) ⓘ | 33.50% | 22.30% |
| Operating Margin (5Y Median) ⓘ | 29.76% | 24.50% |
| Debt to Equity (Latest) ⓘ | 3.40% | 59.34% |
| Profit Margin (Latest) ⓘ | 37.49% | 26.42% |
| Free Cash Flow (Latest) ⓘ | $210.24M | |
Momentum (Price trend) | ||
| 3Y Return ⓘ | +163.14% | +95.73% |
| 12M Return (excl. last month) ⓘ | +36.18% | +17.30% |
| 6M Return ⓘ | +10.29% | +6.07% |
| Price vs. 200-Day MA ⓘ | +7.99% | +5.36% |
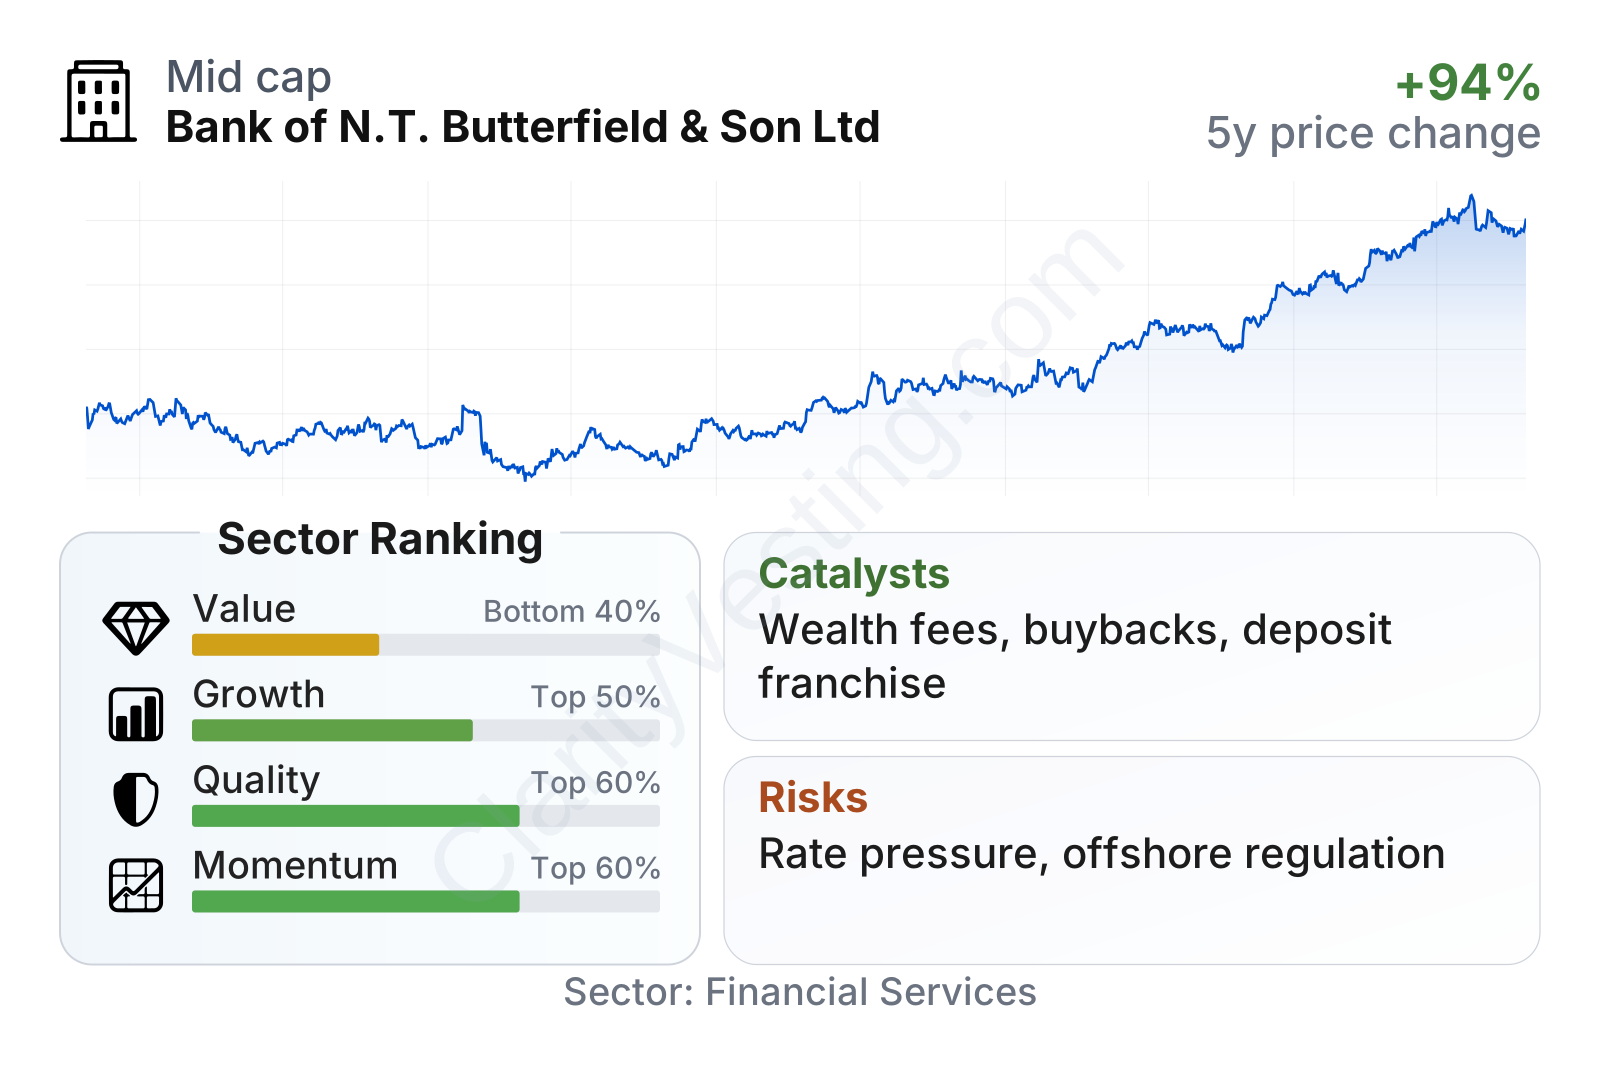
Butterfield sits in the mid-sized bank range by market value and has shown unusually low share-price volatility, with a beta well below 1. The broader profile is mixed but understandable: valuation screens are not especially cheap on book value, quality is clearly above average, growth is respectable rather than exceptional, and recent share-price momentum has been strong. The combination points to a bank the market is rewarding for consistency and profitability, rather than one trading at a distressed or overlooked level.
Growth
Butterfield operates in a mature industry, so its long-term growth does not depend on rapid branch expansion or aggressive loan growth. Instead, it comes from defending and deepening positions in wealthy offshore markets, attracting more client assets, expanding fee-based services, and using excess capital productively. That is a sensible strategy for a specialized bank because it leans into areas where trust, local reputation, and regulatory experience create barriers to entry.
Its markets are not high-growth in population terms, but they remain important hubs for cross-border wealth, insurance, family office activity, fund structures, and international business. That gives Butterfield exposure to attractive client pools even without the scale of a major global bank.
Earnings per share have trended up clearly over the past several years, moving from the low-$3 range in 2021 to above $5 in 2025. That pattern suggests growth has been supported not only by revenue expansion, but also by healthy margins and disciplined capital management.
Book value per share has also climbed meaningfully since 2022. For a bank, that is an important sign because it shows the company has been building shareholder equity while still returning capital through dividends and share repurchases.
A notable catalyst is Butterfield’s ability to keep monetizing its deposit franchise in Bermuda and the Cayman Islands, where low-cost deposits can be especially valuable when interest rates remain above pre-2022 levels. Another growth driver is continued expansion in wealth management and trust, which tends to generate steadier fee income and deepen customer relationships.
Recent company updates have also highlighted capital returns, including dividends and buybacks, as part of the overall shareholder value equation. While capital return is not the same as business expansion, it can support per-share growth when paired with stable profitability and a modest share count.
Risks
This article is for informational purposes only and does not constitute financial advice. Some content is AI-generated. See Disclaimer


