Stock Analysis · Insperity Inc (NSP)
Overview
Insperity Inc is a human resources and business performance services company focused mainly on small and midsize businesses in the United States. Its core offering is a professional employer organization, or PEO, model. In simple terms, clients outsource a large part of their HR administration to Insperity, including payroll processing, employee benefits access, workers’ compensation administration, compliance support, performance management, and other back-office tasks. This can help smaller employers operate with systems and purchasing power that would normally be available only to larger organizations.
The company’s revenue base is heavily concentrated in its PEO business. Based on company reporting, the mix is approximately:
- PEO and related services: about 98% to 99% of revenue. This includes payroll-related billings, access to employee benefits, workers’ compensation coverage, and HR support delivered through the co-employment model.
- Other human capital management services: about 1% to 2% of revenue. This includes standalone HR services outside the main PEO arrangement, such as recruiting support, payroll services, training, and related solutions.
That revenue concentration matters because it makes Insperity easier to understand: the company’s results depend primarily on how many worksite employees it serves, what it charges per employee, benefit cost trends, hiring levels among client companies, and how well it manages insurance and employment-related costs.
Over the last several years, revenue has continued to rise, moving from roughly $5.0 billion in 2021 to about $6.8 billion in 2025. The more important point, however, is that higher revenue has not translated into steadily higher earnings. Gross profit held above $1.0 billion in 2023 and 2024 before dropping to about $0.9 billion in 2025, while operating income and net income fell sharply. That pattern suggests the business has kept expanding in size, but recent cost pressure has reduced profitability.
The long-term picture is one of a large HR outsourcing platform with meaningful scale, but also one whose economics can shift quickly when benefits expenses, compensation costs, or pricing discipline move in the wrong direction.
Key Figures
| Metric | Value | Sector ⓘ |
|---|---|---|
| Date | Oct 17, 2026 | |
| Context | ||
| Sector | Industrials | |
| Industry | Staffing & Employment Services | |
| Market Cap ⓘ | $1.89B | |
| Beta ⓘ | 0.56 | |
Value (Cheapness) | ||
| P/E Ratio ⓘ | N/A | 22.10 |
| P/B Ratio ⓘ | 30.64 | 1.97 |
| FCF Yield ⓘ | 14.57% | 6.38% |
| Dividend Yield ⓘ | 4.95% | 1.94% |
| EBIT / EV ⓘ | 0.58% | 4.79% |
| PEG ⓘ | 1.42 | |
Growth (Business expansion) | ||
| Revenue Growth ⓘ | 1.70% | 9.30% |
| RPS Growth (5Y CAGR) ⓘ | 8.86% | 7.81% |
| EPS Growth (5Y CAGR) ⓘ | -30.75% | -13.06% |
| BVPS Growth (5Y CAGR) ⓘ | N/A | 6.14% |
| Margin Growth (5Y Trend) ⓘ | -3.24% | 0.88% |
| FCF Growth (5Y CAGR) ⓘ | N/A | 11.01% |
| DPS Growth (5Y CAGR) ⓘ | -10.56% | 9.48% |
Quality (Business durability) | ||
| ROIC (Latest) ⓘ | -2.22% | 10.84% |
| ROA (Latest) ⓘ | -0.75% | 5.41% |
| ROIC (5Y Median) ⓘ | 33.18% | 9.38% |
| ROA (5Y Median) ⓘ | 7.44% | 4.95% |
| Net Debt / EBIT (Latest) ⓘ | -14.10 | 2.08 |
| Net Debt / EBIT (5Y Median) ⓘ | -1.19 | 2.27 |
| Net Debt / EBITDA (Latest) ⓘ | -2.61 | 1.39 |
| Net Debt / Assets ⓘ | -6.31% | 19.28% |
| EBITDA / Interest ⓘ | 2.25 | 9.58 |
| Operating Margin (Latest) ⓘ | 0.15% | 10.50% |
| Operating Margin (5Y Median) ⓘ | 3.53% | 10.29% |
| Debt to Equity (Latest) ⓘ | 783.61% | 65.48% |
| Profit Margin (Latest) ⓘ | -0.23% | 6.67% |
| Free Cash Flow (Latest) ⓘ | $275.00M | |
Momentum (Price trend) | ||
| 3Y Return ⓘ | -42.72% | +61.68% |
| 12M Return (excl. last month) ⓘ | +3.74% | +12.58% |
| 6M Return ⓘ | +85.13% | 0.00% |
| Price vs. 200-Day MA ⓘ | +30.16% | +0.02% |
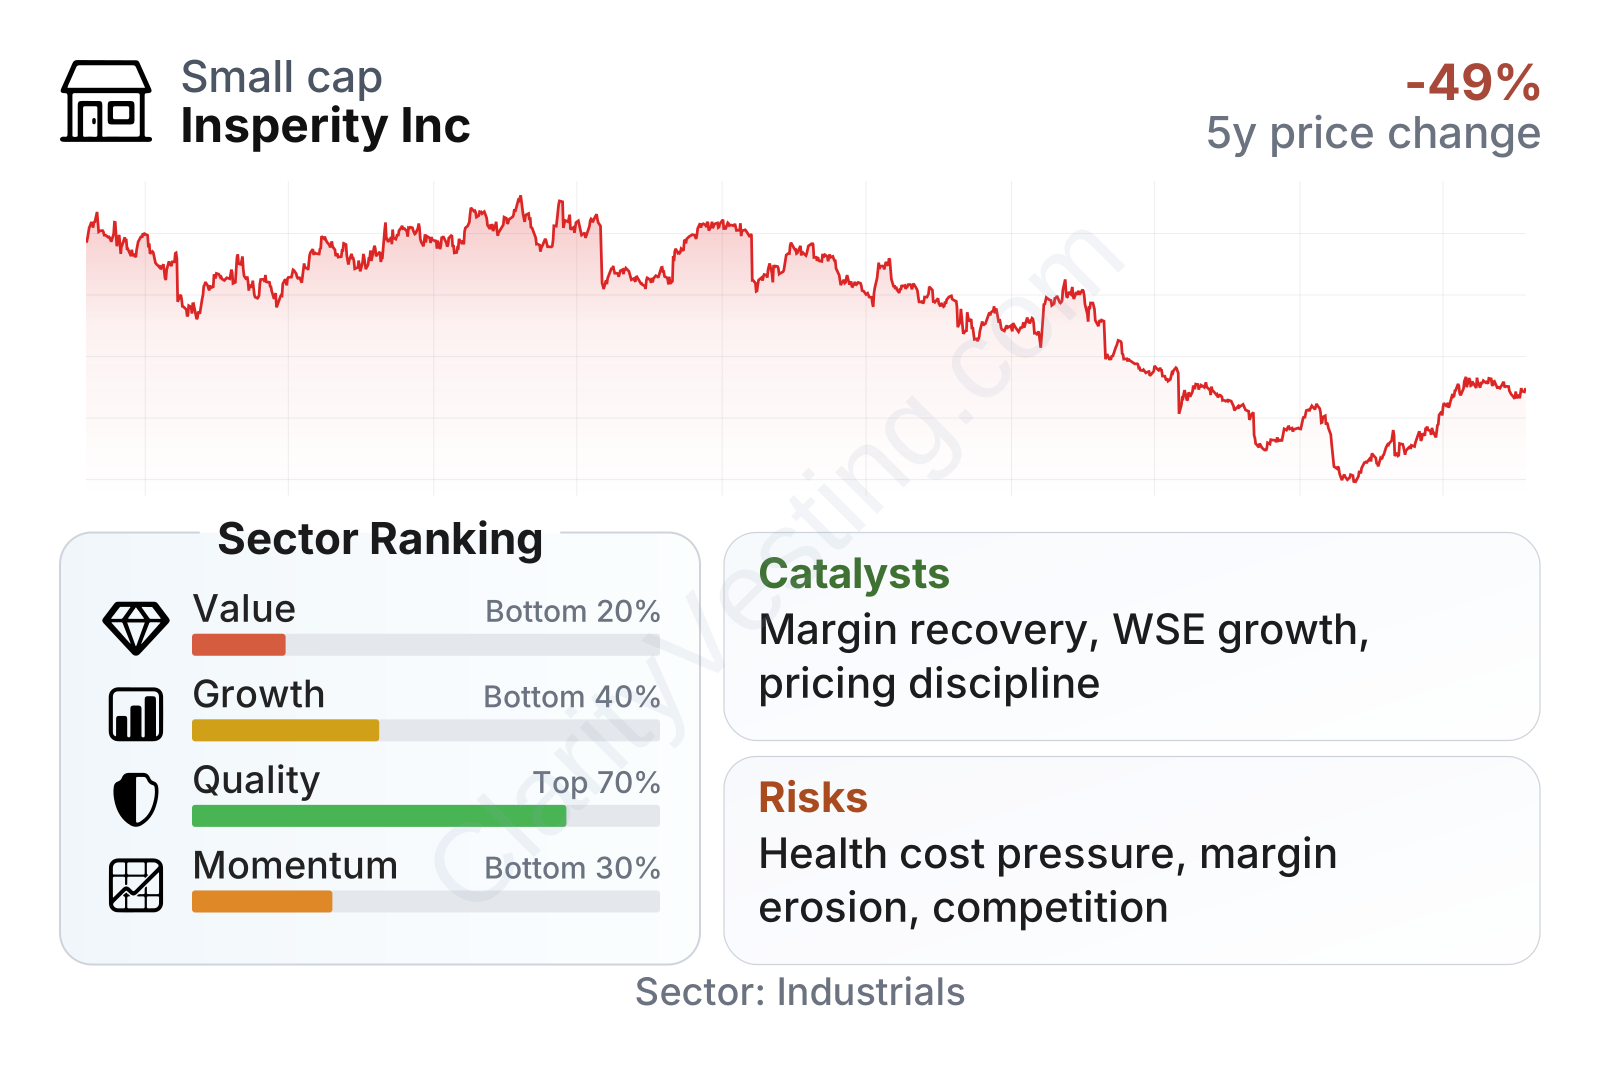
Insperity is currently a smaller public company by market value, and its shares have been far less volatile than the broader market, as reflected by a beta well below 1. The table also shows an unusual mix of signals: income-based valuation measures look weak because recent earnings have deteriorated, while cash-flow-based measures look much stronger. Relative to the sector, growth and momentum rank in the lower part overall, although the recent rebound in the share price has improved shorter-term momentum. Quality metrics are mixed as well: the balance sheet carries very high debt-to-equity on paper, but net debt remains negative, meaning cash still exceeds borrowings.
The stock price history shows a major re-rating. Shares traded near $100 at several points from 2021 through early 2024, then fell sharply into 2026 before a partial recovery. That kind of move usually reflects a business that the market once viewed as steady and premium-rated, but that later faced a meaningful drop in confidence around future earnings power.
Growth
Insperity operates in a sector with durable long-term demand. Small and midsize businesses continue to face rising complexity in payroll, benefits, labor regulation, employee retention, and compliance. Those pressures generally support demand for outsourced HR services. The PEO model can remain relevant for years because it helps clients simplify administration and access broader benefits programs.
Its strategy also makes sense in principle. The company is built around recurring client relationships rather than one-time placements, which can create a more predictable revenue base than some staffing businesses. If Insperity grows the number of worksite employees under service and maintains pricing discipline, revenue can expand steadily. Over a five-year view, revenue per share growth has been solid and slightly ahead of the sector median, which suggests the franchise has had real expansion power even if the recent period has been weaker.
The challenge is that growth has slowed materially. Year-over-year revenue growth was above 20% in 2021 and early 2022, then decelerated steadily and recently moved into the low-single-digit range, around 2%. That is still growth, but it is a very different profile from the earlier post-pandemic expansion. For long-term analysis, this means the company is no longer being supported by strong top-line momentum alone. Future progress likely depends more on execution, pricing, client retention, and margin recovery than on a broad surge in demand.
Cash generation has also become more uneven. Free cash flow was close to $300 million in 2022 and 2023, then dropped sharply before showing some recovery. Even so, the latest trailing figure remains meaningfully positive at roughly $275 million in the broader metrics view, which helps explain why cash-flow valuation looks more favorable than earnings-based valuation. For a business under earnings pressure, that distinction matters: it suggests the core platform still converts activity into cash, even if accounting profits have recently been squeezed.
A practical catalyst would be any improvement in benefits cost trends, especially health plan performance, combined with stronger worksite employee growth. Another potential support is the company’s ability to use its scale and service breadth to win clients that are frustrated by regulatory complexity or rising HR costs. Recent corporate updates have emphasized continued client service investment and the importance of operating efficiency, which points to margin repair as a central opportunity rather than a dramatic change in business direction.
Risks
This article is for informational purposes only and does not constitute financial advice. Some content is AI-generated. See Disclaimer


