Stock Analysis · Neptune Insurance Holdings Inc (NP)
Overview
Neptune Insurance Holdings Inc operates in the insurance distribution and risk management market rather than as a traditional insurance carrier. In practical terms, it helps individuals, businesses, and specialty clients obtain insurance coverage by acting as an intermediary between customers and insurance underwriters. Companies in this model typically earn commissions, fees, and other service income tied to placing policies, advising clients, and managing insurance-related programs.
The business appears to be built around brokerage-style revenue with a relatively asset-light operating model compared with insurers that take underwriting risk directly. That matters for long-term analysis because brokerage businesses can scale through client growth, pricing gains, and acquisitions without needing the same level of balance sheet capital as an insurer.
Based on the company’s public classification and reported income statement structure, the main revenue sources are likely centered on:
- Insurance brokerage and placement commissions — likely the largest source of revenue, generated when policies are sold or renewed through carrier partners.
- Advisory and service fees — fees linked to risk management, policy administration, or specialty insurance services.
- Other insurance-related income — may include program administration, ancillary service income, and smaller recurring client charges.
Public materials available do not provide a reliable segment-by-segment revenue split with precise percentages, so a numerical breakdown by source would not be dependable here. What is visible, however, is a strong top-line expansion: revenue increased from about $85 million in 2023 to roughly $119 million in 2024 and about $160 million in 2025. At the same time, operating income and net income also moved higher, which suggests growth did not come only from volume, but also from maintaining solid margins.
The cost structure is also notable. Revenue has been rising faster than operating expenses, and interest expense declined from 2023 to 2024 before edging up again in 2025. That combination points to improving operating scale, although financing costs still remain meaningful relative to earnings.
The business mix shown here suggests a company that has been converting a growing share of revenue into operating profit, with gross profit and operating income both climbing materially over the last three years. The main area to monitor is interest expense, which still absorbs a noticeable portion of earnings.
Key Figures
| Metric | Value | Sector ⓘ |
|---|---|---|
| Date | Oct 17, 2026 | |
| Context | ||
| Sector | Financial Services | |
| Industry | Insurance Brokers | |
| Market Cap ⓘ | $3.90B | |
| Beta ⓘ | N/A | |
Value (Cheapness) | ||
| P/E Ratio ⓘ | 123.65 | 12.26 |
| P/B Ratio ⓘ | N/A | 1.23 |
| FCF Yield ⓘ | 1.87% | 10.40% |
| Dividend Yield ⓘ | N/A | 3.02% |
| EBIT / EV ⓘ | 1.98% | 8.14% |
| PEG ⓘ | N/A | |
Growth (Business expansion) | ||
| Revenue Growth ⓘ | 32.80% | 9.35% |
| RPS Growth (5Y CAGR) ⓘ | 35.61% | 12.19% |
| EPS Growth (5Y CAGR) ⓘ | N/A | -9.53% |
| BVPS Growth (5Y CAGR) ⓘ | -24.20% | 4.99% |
| Margin Growth (5Y Trend) ⓘ | -8.19% | -3.86% |
| FCF Growth (5Y CAGR) ⓘ | 80.56% | 4.81% |
| DPS Growth (5Y CAGR) ⓘ | -28.91% | 8.79% |
Quality (Business durability) | ||
| ROIC (Latest) ⓘ | N/A | 9.49% |
| ROE (Latest) ⓘ | N/A | 13.90% |
| ROA (Latest) ⓘ | 40.66% | 1.55% |
| ROIC (5Y Median) ⓘ | N/A | 7.86% |
| ROE (5Y Median) ⓘ | N/A | 12.17% |
| ROA (5Y Median) ⓘ | N/A | 1.30% |
| Net Debt / EBIT (Latest) ⓘ | 2.11 | 0.96 |
| Net Debt / EBIT (5Y Median) ⓘ | 3.23 | 0.73 |
| Net Debt / EBITDA (Latest) ⓘ | 2.01 | 0.92 |
| Operating Margin (Latest) ⓘ | 43.81% | 22.30% |
| Operating Margin (5Y Median) ⓘ | 53.24% | 24.63% |
| Debt to Equity (Latest) ⓘ | -107.99% | 58.56% |
| Profit Margin (Latest) ⓘ | 21.45% | 26.57% |
| Free Cash Flow (Latest) ⓘ | $72.96M | |
Momentum (Price trend) | ||
| 3Y Return ⓘ | N/A | +88.33% |
| 12M Return (excl. last month) ⓘ | N/A | +19.38% |
| 6M Return ⓘ | +9.24% | +4.75% |
| Price vs. 200-Day MA ⓘ | +7.53% | +3.50% |
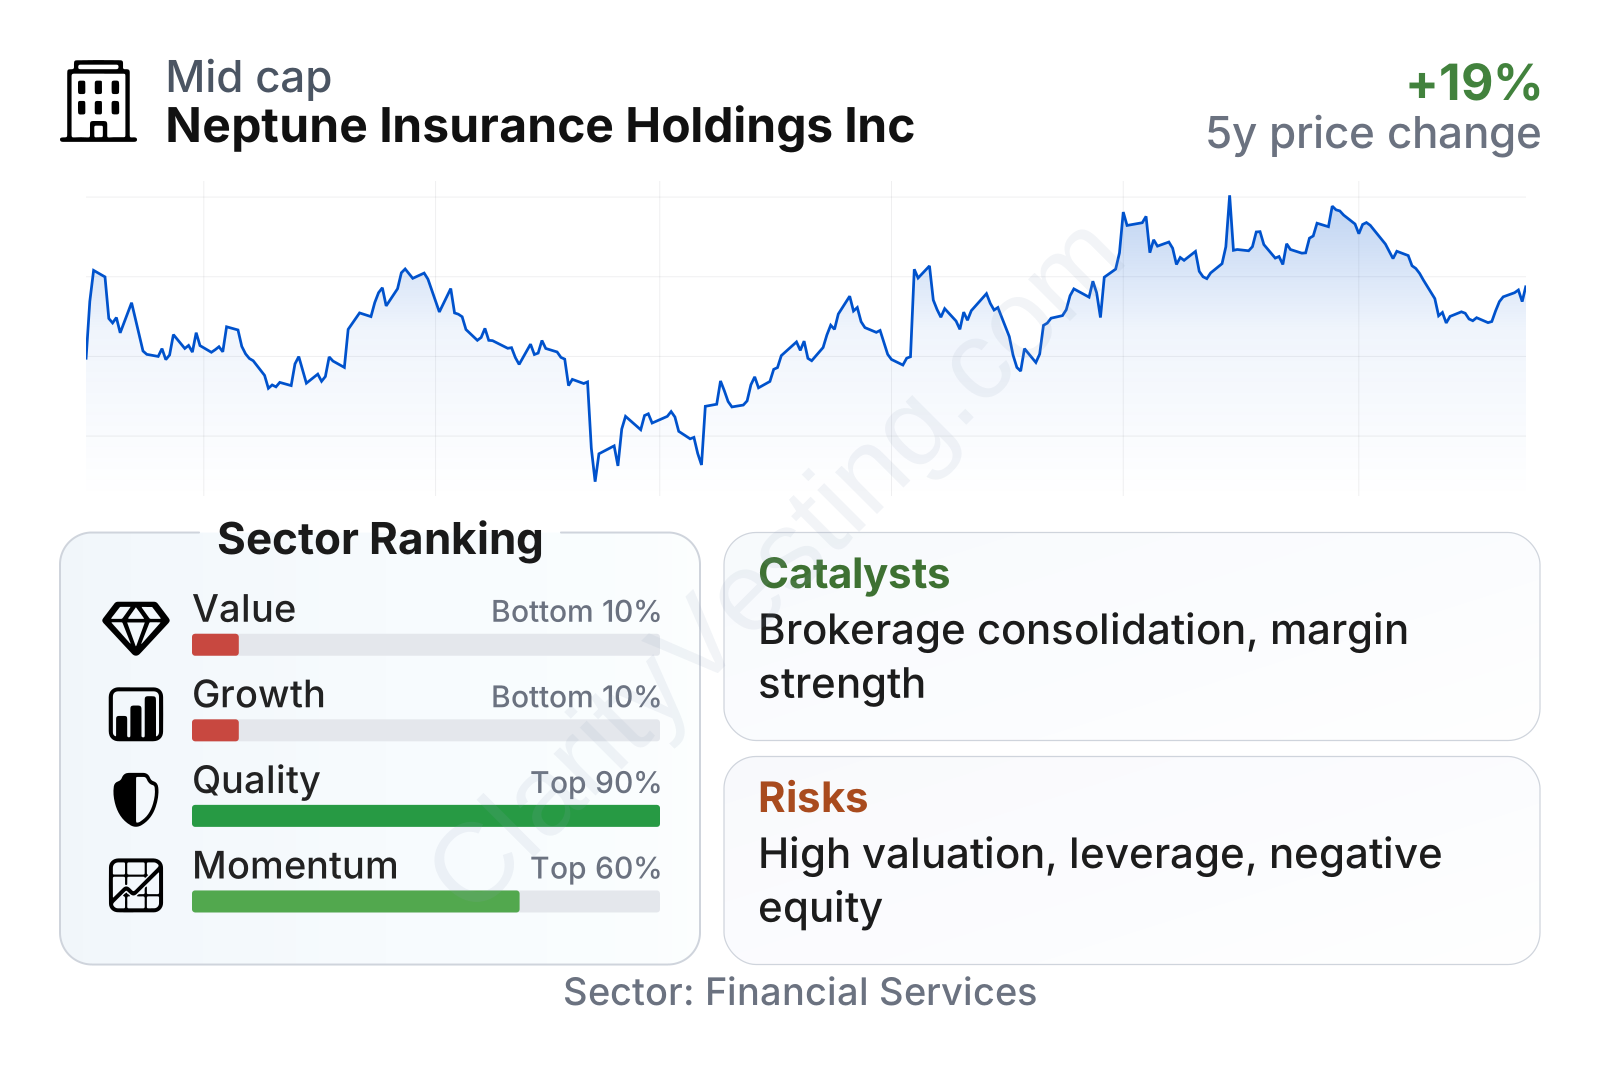
Neptune sits in the smaller public-company range within a very large financial services sector. The profile is unusual: growth has been strong, quality metrics look very high on an asset-return basis, but valuation measures screen as expensive versus sector norms. Revenue growth is well above the sector median, and operating margin is also substantially higher than many peers. At the same time, the earnings multiple is far above the sector median and cash flow yield is much lower, which means the market is already assigning a rich value to current results. Price momentum has been mixed: the shares rebounded strongly over the past several months, but the broader multi-period ranking still does not place the stock among sector leaders.
Growth
Neptune operates in a part of financial services that generally benefits from long-term structural demand. Insurance distribution tends to grow alongside the economy, insured asset values, commercial activity, and rising premium rates. Specialty and advisory-driven insurance businesses can also gain from increasing complexity in risk, regulation, and customized coverage needs. In that sense, the company is positioned in a sector with durable demand rather than a short-lived trend.
Its recent operating trajectory supports that view. Revenue growth of roughly 33% year over year is far above the sector median, and the five-year revenue-per-share growth rate is also much stronger than typical peers. Free cash flow growth has been especially sharp over the longer term. Even more important, operating income has increased each year from 2023 through 2025, indicating that expansion has not come at the expense of profitability.
Earnings per share remain positive, but the recent quarterly level looks more modest than the full-year 2025 figure. That does not necessarily break the broader growth case, but it does suggest that future expansion may be less smooth than the recent revenue trend implies. For long-term analysis, the key question is whether Neptune can keep compounding commissions and fee income faster than its financing and operating costs.
Book value per share remains negative, although it has been improving. That pattern often reflects a balance sheet shaped by acquisitions, debt, or accounting effects rather than a simple cash-rich capital base. For a broker, book value is not always the most useful measure of franchise strength, but a negative reading still matters because it reduces balance-sheet flexibility if growth slows or financing conditions tighten.
A practical catalyst for future growth is continued consolidation in insurance distribution. Brokerage markets often reward firms that can acquire smaller agencies, add specialty capabilities, and cross-sell more services to existing customers. If Neptune keeps expanding revenue while protecting its unusually high operating margin, that combination could remain a meaningful driver of earnings power over time.
Risks
This article is for informational purposes only and does not constitute financial advice. Some content is AI-generated. See Disclaimer


