Stock Analysis · Northern Oil & Gas Inc (NOG)
Overview
Northern Oil & Gas Inc. is an independent oil and gas company, but it operates differently from many traditional drillers. Instead of mainly running rigs itself, it focuses on buying and owning non-operated interests in wells and acreage. In simple terms, other companies usually operate the drilling and day-to-day field work, while Northern Oil & Gas provides capital, owns a share of the production, and collects its portion of the revenue. This model gives it exposure to major U.S. oil and gas basins without having to build a large operating organization.
The company’s assets are concentrated in leading onshore U.S. shale regions, especially the Williston Basin, the Permian Basin, the Appalachian Basin, and the Uinta Basin. Its production mix includes crude oil, natural gas, and natural gas liquids. Because it is a non-operator, Northern Oil & Gas depends heavily on the quality, capital discipline, and drilling plans of the operators it partners with.
Revenue mainly comes from the sale of hydrocarbons produced from its owned interests. Based on the company’s recent filings, the revenue mix is approximately:
- Oil: about 56% to 60% of total oil and gas sales. This is the largest source and usually drives most of the company’s economics because oil prices are typically higher on an energy-equivalent basis.
- Natural gas: about 22% to 26%. This includes dry gas volumes sold into U.S. markets and is more sensitive to gas price swings.
- Natural gas liquids: about 18% to 20%. This category includes products such as propane, butane, and other liquids extracted from gas streams.
The business model is relatively straightforward: acquire mineral and working interests, fund development with experienced operators, collect production revenue, and recycle cash into more deals, debt service, and shareholder returns. That structure can scale efficiently, but it also means results are tied to commodity prices and acquisition quality.
The financial flow over the last several years shows a business that benefited strongly from the 2022–2024 commodity environment, with revenue rising above $2 billion by 2024. More recently, profitability has tightened as costs and interest expense absorbed a much larger share of revenue, which helps explain why current financial quality looks weaker than the company’s longer-term record.
Key Figures
| Metric | Value | Sector ⓘ |
|---|---|---|
| Date | Oct 17, 2026 | |
| Context | ||
| Sector | Energy | |
| Industry | Oil & Gas E&P | |
| Market Cap ⓘ | $2.81B | |
| Beta ⓘ | 0.92 | |
Value (Cheapness) | ||
| P/E Ratio ⓘ | N/A | 15.44 |
| P/B Ratio ⓘ | 1.42 | 1.73 |
| FCF Yield ⓘ | -29.82% | 8.20% |
| Dividend Yield ⓘ | 7.08% | 3.59% |
| EBIT / EV ⓘ | -9.18% | 7.46% |
| PEG ⓘ | 7.35 | |
Growth (Business expansion) | ||
| Revenue Growth ⓘ | 16.00% | 26.90% |
| RPS Growth (5Y CAGR) ⓘ | 8.04% | 6.90% |
| EPS Growth (5Y CAGR) ⓘ | -28.37% | -15.73% |
| BVPS Growth (5Y CAGR) ⓘ | 58.23% | 6.07% |
| Margin Growth (5Y Trend) ⓘ | 4.49% | 0.58% |
| FCF Growth (5Y CAGR) ⓘ | N/A | 1.86% |
| DPS Growth (5Y CAGR) ⓘ | 33.96% | 16.79% |
Quality (Business durability) | ||
| ROIC (Latest) ⓘ | -8.25% | 11.40% |
| ROA (Latest) ⓘ | -8.59% | 6.06% |
| ROIC (5Y Median) ⓘ | 14.95% | 10.30% |
| ROA (5Y Median) ⓘ | 10.32% | 5.42% |
| Net Debt / EBIT (Latest) ⓘ | N/A | 1.64 |
| Net Debt / EBIT (5Y Median) ⓘ | 2.81 | 1.83 |
| Net Debt / EBITDA (Latest) ⓘ | 8.33 | 1.08 |
| Net Debt / Assets ⓘ | 45.94% | 17.29% |
| EBITDA / Interest ⓘ | 1.91 | 9.64 |
| Operating Margin (Latest) ⓘ | -21.21% | 16.27% |
| Operating Margin (5Y Median) ⓘ | 38.75% | 20.39% |
| Debt to Equity (Latest) ⓘ | 136.56% | 54.76% |
| Profit Margin (Latest) ⓘ | -24.15% | 8.82% |
| Free Cash Flow (Latest) ⓘ | -$838.46M | |
Momentum (Price trend) | ||
| 3Y Return ⓘ | -22.27% | +67.38% |
| 12M Return (excl. last month) ⓘ | +11.76% | +49.19% |
| 6M Return ⓘ | +6.95% | +7.07% |
| Price vs. 200-Day MA ⓘ | +12.95% | +9.56% |
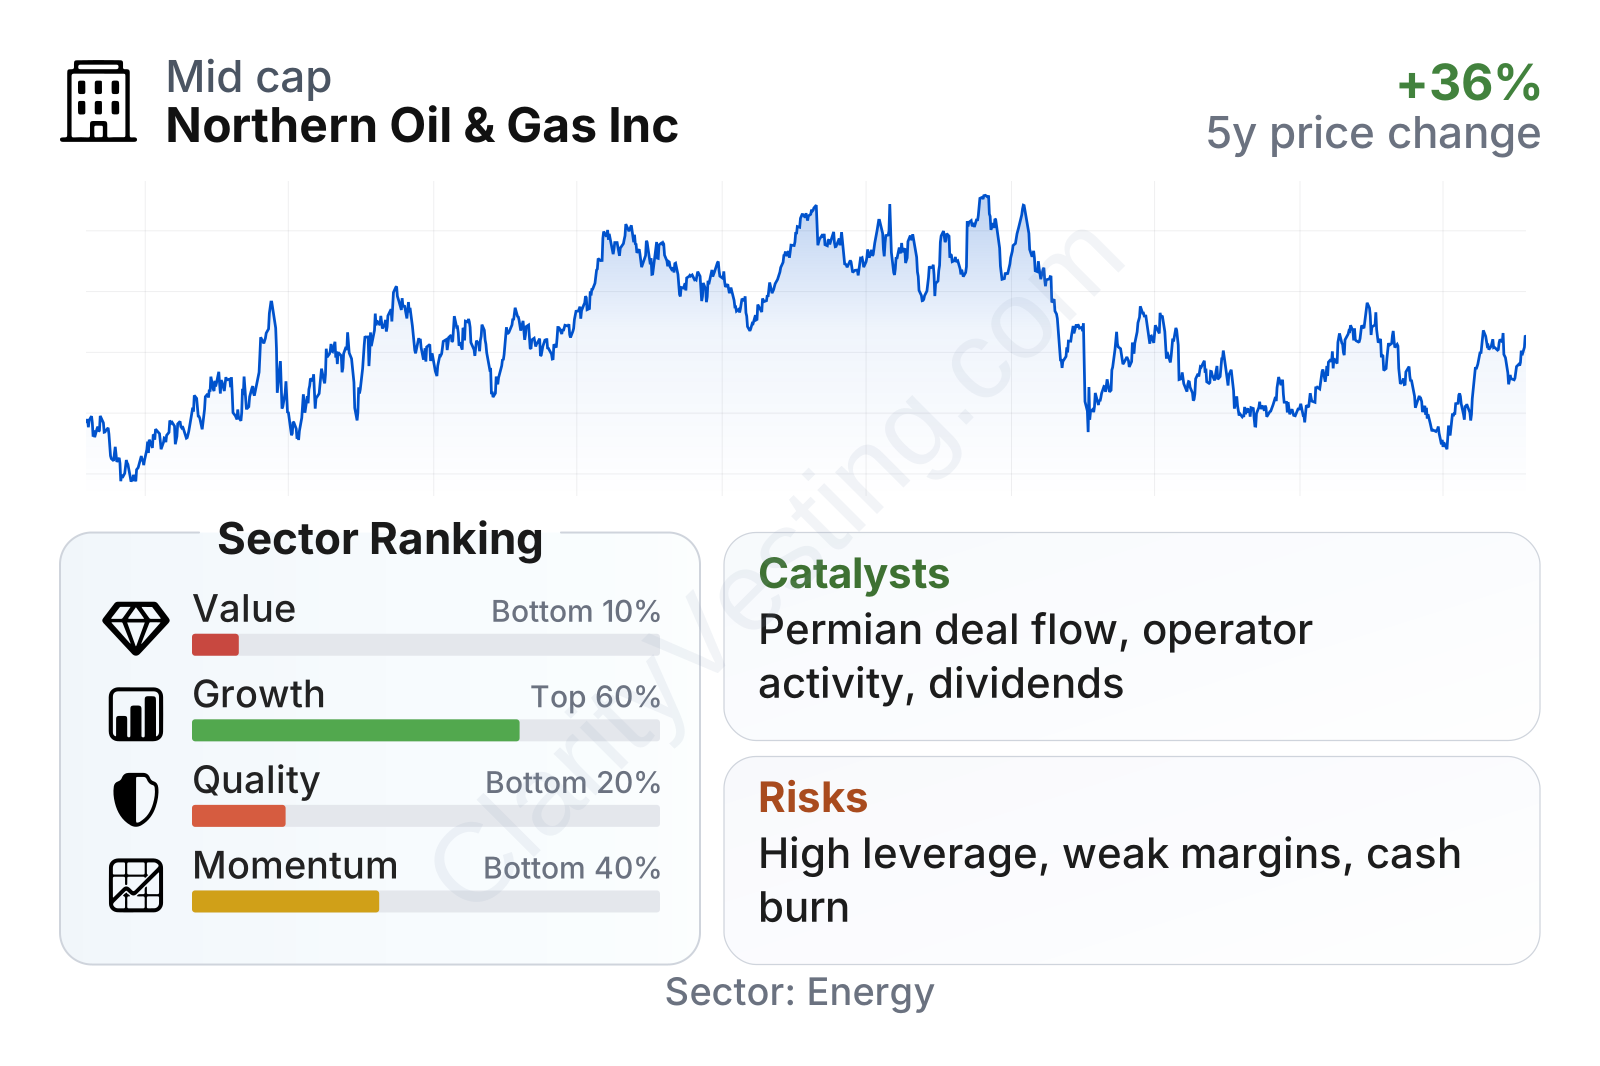
Northern Oil & Gas is a mid-sized exploration and production company with a market value around the low single-digit billions. The table points to a mixed profile. Growth indicators are around the middle of the sector, helped by decent multi-year revenue-per-share expansion, rising book value, and a fast increase in the dividend over five years. However, current quality and momentum appear weak. Profitability has turned negative on a trailing basis, leverage is elevated versus the sector median, and recent share-price performance has lagged much of the energy group. The value profile also looks complicated rather than obviously cheap, because traditional low-multiple signals are offset by negative free cash flow and negative trailing EBIT-based valuation metrics.
Growth
The company operates in a sector that remains strategically important. Oil and gas are still essential for transportation, petrochemicals, power reliability, and heating, even as the broader energy system gradually diversifies. Within that sector, Northern Oil & Gas is positioned in U.S. shale basins that continue to attract capital because they offer relatively short project cycles, large existing infrastructure, and flexible development timing.
Its strategy is built around consolidation and capital allocation rather than operating scale. That can make sense for future growth because the non-operated model allows the company to expand through acquisitions across multiple basins without bearing the full fixed-cost burden of field operations. It also spreads geological and operational risk across different operators and regions. If management acquires assets at disciplined prices and partners with strong operators, this model can support production growth and reserve replacement with less overhead than many peers.
Revenue growth has been uneven, which is normal in this industry. The pattern shows very strong growth in 2022, a slowdown and some negative periods in 2023, stabilization in 2024 and 2025, and a stronger rebound in the latest period. That volatility says more about commodity prices, deal timing, and production mix than about simple customer demand. Over a five-year period, revenue per share has still grown faster than the sector median, which suggests the company has expanded its asset base in a meaningful way.
Free cash flow is the main weak spot in the growth picture. It has remained negative in the recent trailing periods shown here, including a particularly deep outflow in the latest reading. For an acquisitive upstream company, negative free cash flow can happen when it is buying assets or funding development, but it reduces flexibility and raises the importance of commodity prices, debt access, and disciplined capital deployment. In other words, the company still has a pathway to growth, but that pathway currently depends on execution and financing conditions more than on internally generated surplus cash.
Recent company updates have continued to emphasize acquisitions, basin diversification, and returns of capital through dividends and share repurchases. The most meaningful potential catalyst is the combination of a broad asset footprint and operator relationships across top U.S. shale plays. If drilling activity on those properties remains active and commodity prices improve, production and cash generation can recover quickly because the company already owns interests in productive areas rather than relying on long-dated exploration.
Risks
This article is for informational purposes only and does not constitute financial advice. Some content is AI-generated. See Disclaimer


