Stock Analysis · Newmark Group Inc (NMRK)
Overview
Newmark Group is a commercial real estate services company. In simple terms, it helps property owners, tenants, investors, and lenders buy, sell, lease, finance, value, and manage commercial real estate. Its work spans offices, industrial buildings, multifamily housing, retail properties, hospitality assets, data centers, and other specialized property types. The company operates mainly in the United States, with an international presence as well, and combines brokerage, advisory, valuation, and servicing activities.
Its revenue base is diversified across several service lines, but transaction-related businesses still matter a great deal, which means activity levels in property sales, leasing, and capital markets have a large influence on results. Based on the company’s recent annual reporting structure, the main revenue sources are approximately the following:
- Leasing and other commissions — about 35% to 40%: fees earned from arranging office, industrial, retail, and other property leases.
- Capital markets, including investment sales — about 20% to 25%: revenue tied to property sales, debt placement, structured financing, and related advisory assignments.
- Servicing fees and other revenues — about 15% to 20%: recurring income from loan servicing and related activities, especially through its mortgage and asset servicing platform.
- Valuation and advisory — about 10% to 15%: appraisal, diligence, consulting, and analytics work for lenders, owners, and institutional clients.
- Management services and facilities-related activities — about 10% to 15%: property management, project management, and workplace-related services.
That mix matters for long-term analysis. Newmark is not just a pure broker dependent on property sales, because it also has more recurring fee streams such as servicing, management, and valuation. At the same time, it is still meaningfully exposed to the health of commercial real estate markets. Over the last several years, revenue fell from the 2021 peak, then rebuilt strongly into 2025, while profitability remained much thinner than in the boom period. This points to a business that can recover with market activity, but not one that is insulated from industry cycles.
The financial flow over time shows a sharp drop in earnings after 2021, followed by a gradual recovery. Revenue improved meaningfully again by 2025, but net income remained far below the level reached during the unusually strong transaction environment of 2021, which highlights how sensitive margins are to market conditions and compensation costs.
Key Figures
| Metric | Value | Sector ⓘ |
|---|---|---|
| Date | Oct 17, 2026 | |
| Context | ||
| Sector | Real Estate | |
| Industry | Real Estate Services | |
| Market Cap ⓘ | $2.91B | |
| Beta ⓘ | 1.76 | |
Value (Cheapness) | ||
| P/E Ratio ⓘ | 15.27 | 17.38 |
| P/B Ratio ⓘ | 2.64 | 0.85 |
| FCF Yield ⓘ | 27.36% | 7.38% |
| Dividend Yield ⓘ | 1.30% | 4.85% |
| EBIT / EV ⓘ | 7.09% | 3.78% |
| PEG ⓘ | N/A | |
Growth (Business expansion) | ||
| Revenue Growth ⓘ | 17.00% | 5.30% |
| RPS Growth (5Y CAGR) ⓘ | -2.95% | 6.02% |
| EPS Growth (5Y CAGR) ⓘ | -19.19% | -11.37% |
| BVPS Growth (5Y CAGR) ⓘ | 0.63% | 0.45% |
| Margin Growth (5Y Trend) ⓘ | -36.15% | -0.22% |
| FCF Growth (5Y CAGR) ⓘ | N/A | 5.40% |
| DPS Growth (5Y CAGR) ⓘ | 21.78% | 5.02% |
Quality (Business durability) | ||
| ROIC (Latest) ⓘ | 7.06% | 5.69% |
| ROE (Latest) ⓘ | 13.12% | 7.56% |
| ROA (Latest) ⓘ | 2.78% | 2.85% |
| ROIC (5Y Median) ⓘ | 6.38% | 4.22% |
| ROE (5Y Median) ⓘ | 9.63% | 6.03% |
| ROA (5Y Median) ⓘ | 1.82% | 2.44% |
| Net Debt / EBIT (Latest) ⓘ | 6.15 | 7.59 |
| Net Debt / EBIT (5Y Median) ⓘ | 7.06 | 8.40 |
| Net Debt / EBITDA (Latest) ⓘ | 3.86 | 5.27 |
| Net Debt / Assets ⓘ | 36.89% | 37.76% |
| EBITDA / Interest ⓘ | 7.71 | 4.10 |
| Operating Margin (Latest) ⓘ | 8.63% | 35.29% |
| Operating Margin (5Y Median) ⓘ | 6.86% | 37.31% |
| Debt to Equity (Latest) ⓘ | 150.26% | 88.87% |
| Profit Margin (Latest) ⓘ | 4.11% | 19.61% |
| Free Cash Flow (Latest) ⓘ | $797.58M | |
Momentum (Price trend) | ||
| 3Y Return ⓘ | +110.90% | +30.75% |
| 12M Return (excl. last month) ⓘ | -24.91% | +4.36% |
| 6M Return ⓘ | -24.47% | -2.52% |
| Price vs. 200-Day MA ⓘ | -21.05% | -2.34% |
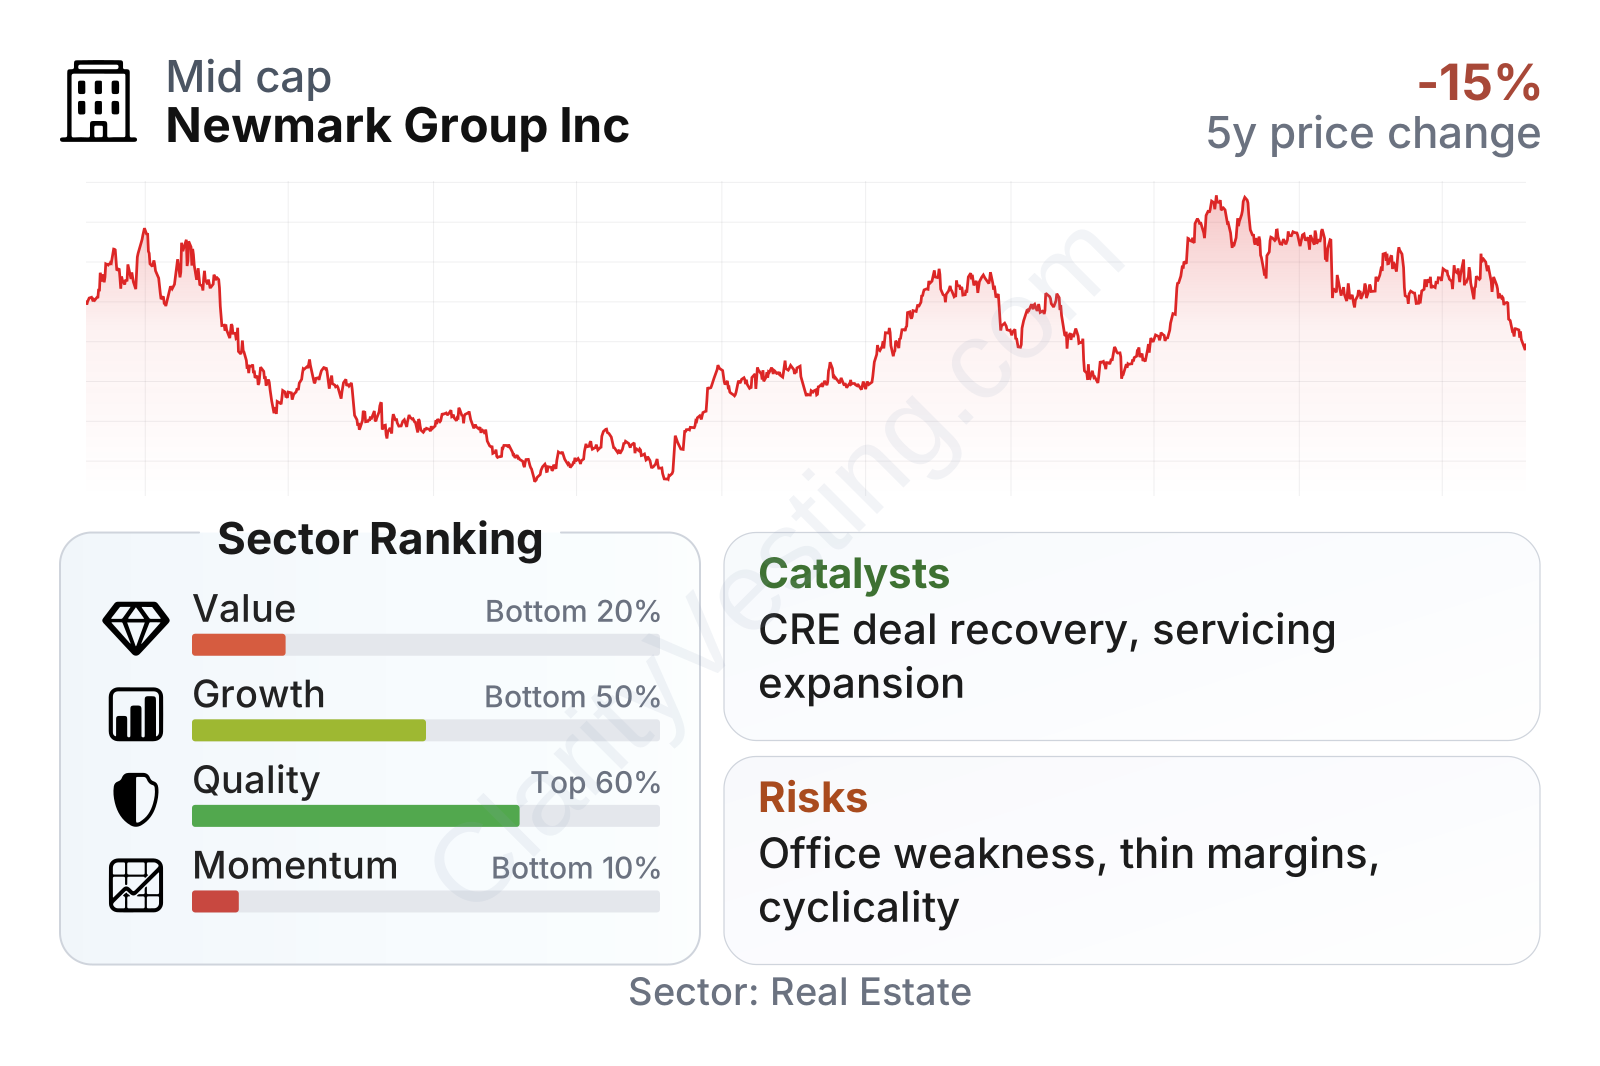
Newmark is a mid-sized real estate services company with a stock that has been volatile, reflected in a beta well above 1. On valuation, the picture is mixed: earnings-based multiples are not stretched versus the sector, and free cash flow generation appears strong, but the stock trades at a clear premium to sector book value multiples. Quality metrics are respectable overall, with return on equity and interest coverage better than many peers, while growth and recent price momentum rank lower. The key takeaway is that the market is recognizing improved cash generation and operating recovery, but it is not assigning the company a top-tier growth profile.
Growth
Newmark operates in a sector that should remain relevant over the long run, even though it is cyclical. Commercial real estate will continue to need brokers, appraisers, financing advisers, and servicing platforms. The more important question is not whether the sector exists, but which parts are expanding. Today, the healthier areas include industrial properties, multifamily, alternative assets, data centers, and outsourcing of advisory and servicing functions. Areas tied heavily to traditional office demand remain more challenged.
Newmark’s strategy is logical for this environment. The company has been building a broader platform rather than depending only on office leasing and property sales. Its presence in valuation, servicing, debt advisory, and management services gives it multiple ways to benefit if capital markets normalize and if institutional clients keep consolidating service providers. The business is also large enough to compete for national assignments, but still smaller and more focused than the biggest global real estate service firms.
Revenue per share has been uneven rather than steadily compounding. There was a major drop after 2021, then a recovery through 2024, followed by some pressure again in 2025. That pattern fits the company’s end markets: activity can rebound sharply, but growth is not smooth. For long-term analysis, this makes it important to separate temporary recovery from durable compounding.
A meaningful catalyst is a broader recovery in commercial property transactions and debt markets. When financing becomes easier and buyers and sellers can agree on pricing, brokers and capital markets advisers usually see activity improve. Newmark is positioned to benefit from that kind of normalization. In addition, recurring servicing and advisory revenue can help support performance between transaction upcycles.
Another positive signal is that recent year-over-year revenue growth has been stronger than the sector median. That suggests the company has been participating in the recovery more effectively than many peers, even if its five-year record still looks weaker because of the downturn period. The business has also kept dividend payments in place and expanded them significantly from very low levels earlier in the cycle.
Dividend per share has grown sharply over the five-year view, although the absolute yield remains modest and payments have not moved in a straight line. That suggests management has become more willing to return cash, but income generation is not the central element of the equity case.
As for recent developments, the most significant opportunity remains operational rather than headline-driven: if commercial real estate volumes continue recovering in 2026, Newmark’s mix of leasing, investment sales, debt placement, valuation, and servicing gives it several channels to capture that rebound. Recent company communications have continued to emphasize hiring producers, expanding in resilient property categories, and strengthening its capital markets and servicing capabilities.
Risks
This article is for informational purposes only and does not constitute financial advice. Some content is AI-generated. See Disclaimer


