Stock Analysis · Annaly Capital Management Inc (NLY)
Overview
Annaly Capital Management is a mortgage real estate investment trust, or mortgage REIT. Unlike a traditional property REIT that owns buildings, Annaly mainly invests in mortgage-related financial assets and earns money from the spread between the yield on those assets and its own funding costs. In simple terms, it borrows at one rate, invests at another, and tries to manage the difference while protecting itself from large interest-rate swings.
The company’s portfolio is centered on residential mortgage assets, especially agency mortgage-backed securities. These are pools of home loans packaged into bonds and backed by U.S. government-sponsored entities such as Fannie Mae and Freddie Mac. Annaly also has smaller businesses in residential credit, mortgage servicing rights, and selective commercial real estate finance activities, which are meant to diversify earnings beyond its core agency strategy.
Based on the company’s recent disclosures, revenue generation is driven primarily by its investment portfolio and financing spread rather than by product sales in the usual sense. The broad economic exposure can be summarized as follows:
- Agency residential mortgage-backed securities: approximately 70% to 80% of capital allocation in recent periods. This is the core business and includes securities with agency backing, which lowers credit risk but leaves Annaly very exposed to interest rates and funding costs.
- Residential credit: approximately 10% to 20%. This includes non-agency mortgage assets and related credit investments, where returns can be higher but credit risk is also higher.
- Mortgage servicing rights: approximately 5% to 10%. These assets can gain value when interest rates rise and can act as a hedge against some pressure on mortgage securities.
- Commercial real estate and other investments: generally less than 10%. This is a smaller, more selective part of the platform.
That mix matters because Annaly is not a simple income vehicle. Its results depend heavily on interest-rate policy, mortgage spreads, hedging execution, and access to short-term funding markets. Over the last few years, earnings and book value have moved sharply as those conditions changed.
The financial flow over time shows how volatile this business can be. Revenue and net income swung sharply from strong profitability to losses and back again, largely because financing costs and mortgage valuation changes can move quickly. One notable point is that interest expense became much heavier after rates moved higher, which helps explain why Annaly’s earnings profile has been uneven even when portfolio income recovered.
Key Figures
| Metric | Value | Sector ⓘ |
|---|---|---|
| Date | Oct 03, 2026 | |
| Context | ||
| Sector | Real Estate | |
| Industry | REIT - Mortgage | |
| Market Cap ⓘ | $14.24B | |
| Beta ⓘ | 1.24 | |
Value (Cheapness) | ||
| P/E Ratio ⓘ | 4.91 | 17.35 |
| P/B Ratio ⓘ | 0.81 | 0.86 |
| FCF Yield ⓘ | -2.21% | 7.47% |
| Dividend Yield ⓘ | 14.56% | 4.75% |
| EBIT / EV ⓘ | 5.78% | 3.81% |
| PEG ⓘ | 32.03 | |
Growth (Business expansion) | ||
| Revenue Growth ⓘ | 479.40% | 5.30% |
| RPS Growth (5Y CAGR) ⓘ | 49.27% | 5.96% |
| EPS Growth (5Y CAGR) ⓘ | -23.64% | -11.41% |
| BVPS Growth (5Y CAGR) ⓘ | -6.41% | 0.41% |
| Margin Growth (5Y Trend) ⓘ | -250.12% | 0.53% |
| FCF Growth (5Y CAGR) ⓘ | N/A | 5.40% |
| DPS Growth (5Y CAGR) ⓘ | -6.29% | 5.02% |
Quality (Business durability) | ||
| ROIC (Latest) ⓘ | 17.14% | 5.77% |
| ROE (Latest) ⓘ | 18.09% | 7.64% |
| ROA (Latest) ⓘ | 2.19% | 2.85% |
| ROIC (5Y Median) ⓘ | 16.11% | 4.20% |
| ROE (5Y Median) ⓘ | 13.10% | 6.03% |
| ROA (5Y Median) ⓘ | 1.70% | 2.45% |
| Net Debt / EBIT (Latest) ⓘ | 14.98 | 7.57 |
| Net Debt / EBIT (5Y Median) ⓘ | 9.12 | 8.41 |
| Net Debt / EBITDA (Latest) ⓘ | 14.96 | 5.12 |
| Net Debt / Assets ⓘ | 84.89% | 37.84% |
| EBITDA / Interest ⓘ | 1.58 | 4.11 |
| Operating Margin (Latest) ⓘ | 111.84% | 35.40% |
| Operating Margin (5Y Median) ⓘ | 96.82% | 36.59% |
| Debt to Equity (Latest) ⓘ | 738.19% | 89.06% |
| Profit Margin (Latest) ⓘ | 90.68% | 19.99% |
| Free Cash Flow (Latest) ⓘ | -$314.44M | |
Momentum (Price trend) | ||
| 3Y Return ⓘ | +53.30% | +30.60% |
| 12M Return (excl. last month) ⓘ | +21.73% | +7.55% |
| 6M Return ⓘ | -5.03% | +0.69% |
| Price vs. 200-Day MA ⓘ | -10.36% | -2.30% |
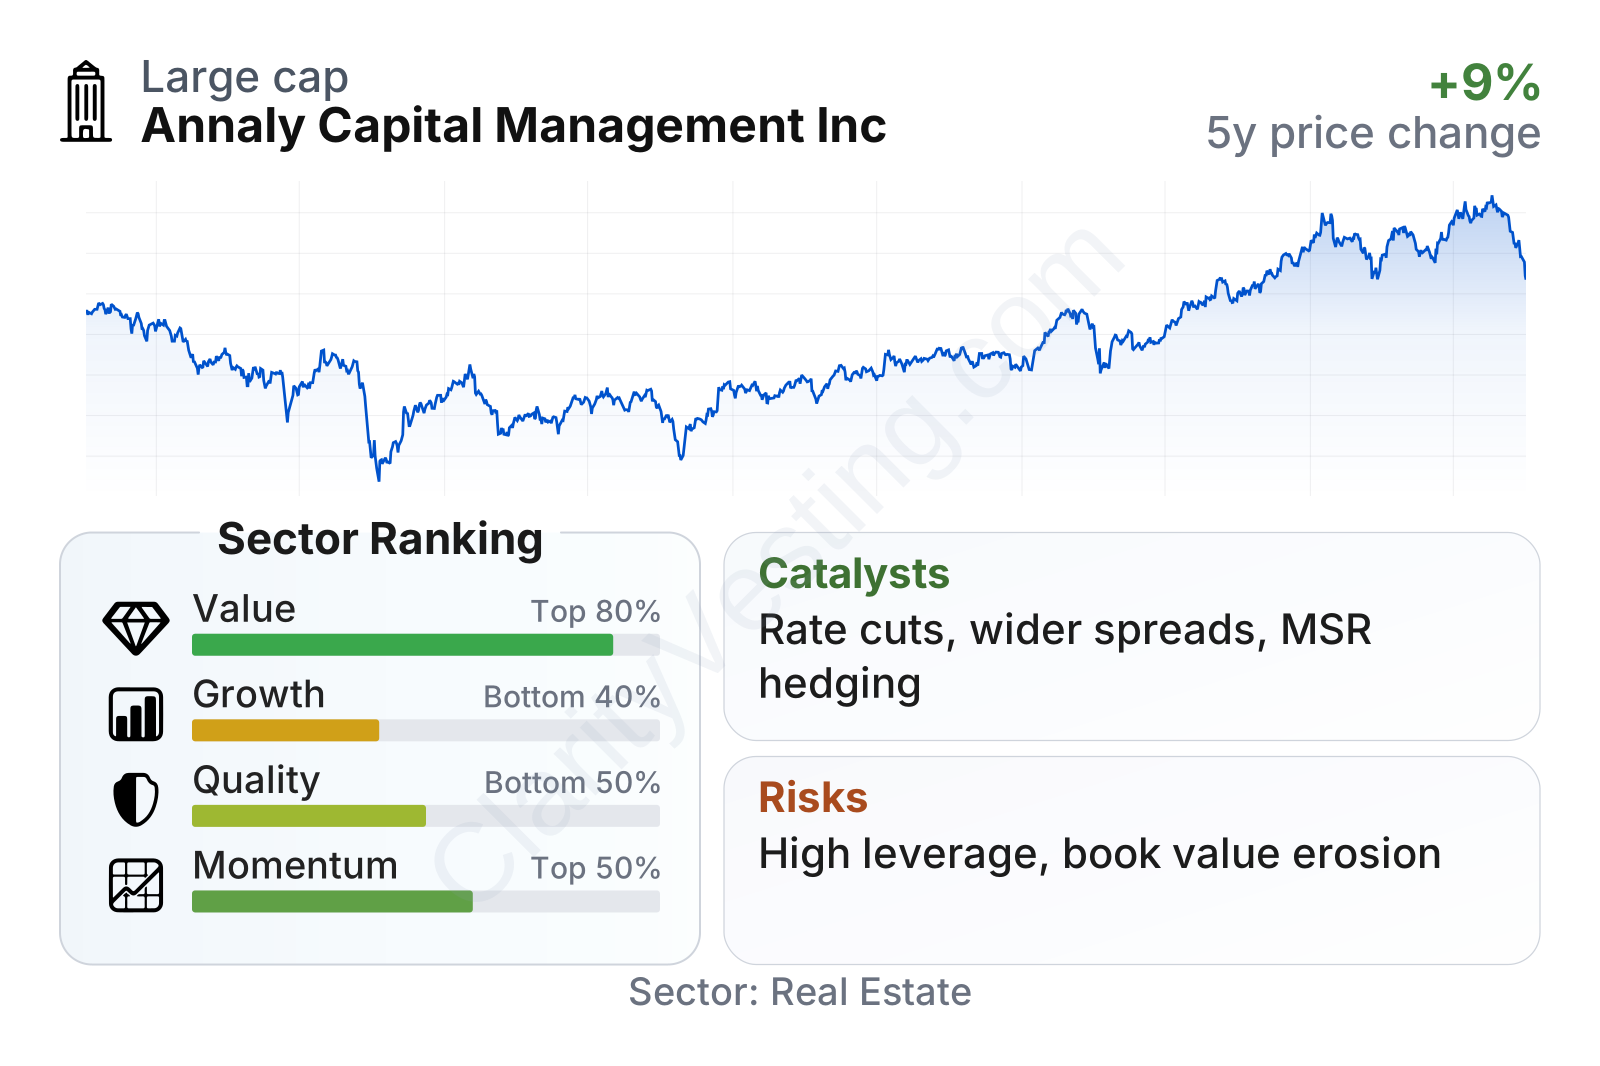
Annaly is a large mortgage REIT with above-average share price momentum over the last one- and three-year periods, but its fundamentals are mixed. The valuation profile looks optically inexpensive on earnings, mainly because the P/E ratio is far below the sector median and the dividend yield is much higher than peers. However, the growth profile ranks in the lower part of the sector, and leverage-related quality measures remain weak. In short, the market is recognizing income generation and recent recovery, while still discounting the balance-sheet risk and uneven long-term compounding record.
Growth
Annaly operates in a sector that remains relevant but is not a straightforward long-term growth industry in the way software or health care can be. Mortgage REITs do not usually grow by steadily increasing demand for a product. Instead, they grow when the interest-rate environment, mortgage spreads, financing markets, and portfolio positioning line up in their favor. That makes the sector more cyclical than structurally expansive.
For Annaly, the long-term case depends less on rapid expansion and more on disciplined capital allocation. Its strategy makes sense in that context. The company focuses on agency mortgage-backed securities, where credit risk is lower, and it supplements that with mortgage servicing rights and selective credit investments to reduce dependence on a single market driver. That combination can help stabilize results when rate conditions are challenging, although it does not remove volatility.
Revenue per share has been highly irregular rather than steadily rising. There was a sharp rebound after the weak 2023 period, but the pattern still reflects a business tied to market conditions more than organic growth. That helps explain why the company’s recent year-over-year growth looks strong while its broader five-year growth ranking remains weak.
The dividend profile tells a similar story. Annaly continues to distribute a high level of income, but the dividend per share has trended down over the last five years before showing some stabilization. For a mortgage REIT, that usually signals that earnings power has been pressured by a tougher rate environment and changing portfolio economics.
A major catalyst for future performance is the path of U.S. interest rates. If short-term funding costs ease and the spread between mortgage asset yields and funding improves, earnings capacity can strengthen meaningfully. Another helpful factor is Annaly’s scale. As one of the largest players in mortgage REITs, it has broad market access, an established hedging platform, and the ability to reposition capital across agency securities, servicing rights, and credit when conditions shift.
Recent company updates have continued to emphasize liquidity, active hedging, and portfolio reallocation toward areas with more attractive risk-adjusted returns. That does not create a dramatic expansion narrative, but it does support the idea that Annaly’s opportunity set improves when monetary policy becomes less restrictive and mortgage market volatility starts to normalize.
Risks
This article is for informational purposes only and does not constitute financial advice. Some content is AI-generated. See Disclaimer


