Stock Analysis · Ninety One Group (NINTF)
Overview
Ninety One Group is an asset manager. In simple terms, it manages money on behalf of clients such as pension funds, insurers, financial advisers, wealth managers, and individual savers. The company was founded in South Africa and now operates as an international investment firm with a strong presence in both South Africa and global markets. Its products span equities, fixed income, multi-asset strategies, alternatives, and specialist offerings including emerging markets and sustainability-related capabilities.
The business model is relatively straightforward: Ninety One earns management fees based mainly on the value of assets it manages, and it may also earn performance fees when certain funds outperform agreed benchmarks. That means revenue tends to rise when assets under management grow, when investment performance is strong, and when net inflows from clients are positive.
Based on company reporting, revenue is primarily split between recurring management fees and a smaller contribution from performance fees and other income. A practical way to think about the revenue mix is:
- Management fees: about 85% to 95% of revenue. This is the core business and reflects fees charged for running client portfolios across equities, bonds, multi-asset portfolios, and alternatives.
- Performance fees: about 3% to 10% of revenue. These depend on fund performance and can be volatile from year to year.
- Other income: about 1% to 5% of revenue. This can include smaller administrative or related operating items.
Geographically, the business is diversified between South Africa and international markets, which matters because it reduces dependence on one client base or one economy. By client type, institutional mandates and adviser-led channels remain especially important, while the company also has exposure to wealth platforms and selected direct savings products.
The earnings profile is typical of an asset manager: costs are meaningful, but once scale is reached, margins can be attractive. Over the past several years, revenue has moved with market conditions, while profitability has remained solid. The latest annual period also shows a rebound in total revenue after a weaker phase in earlier years.
The broad picture is a business with good fee-based economics. Revenue fell between fiscal 2022 and fiscal 2024, then recovered in fiscal 2025 and again in fiscal 2026. Operating profit stayed resilient through that period, showing that the company has been able to protect profitability even when top-line conditions were uneven.
Key Figures
| Metric | Value | Sector ⓘ |
|---|---|---|
| Date | Oct 17, 2026 | |
| Context | ||
| Sector | Financial Services | |
| Industry | Asset Management | |
| Market Cap ⓘ | $2.49B | |
| Beta ⓘ | 0.76 | |
Value (Cheapness) | ||
| P/E Ratio ⓘ | 11.30 | 12.26 |
| P/B Ratio ⓘ | 4.54 | 1.23 |
| FCF Yield ⓘ | 19.62% | 10.40% |
| Dividend Yield ⓘ | 5.15% | 3.02% |
| EBIT / EV ⓘ | N/A | 8.14% |
| PEG ⓘ | N/A | |
Growth (Business expansion) | ||
| Revenue Growth ⓘ | 13.50% | 9.35% |
| RPS Growth (5Y CAGR) ⓘ | -6.52% | 12.19% |
| EPS Growth (5Y CAGR) ⓘ | 18.16% | -9.53% |
| BVPS Growth (5Y CAGR) ⓘ | 12.41% | 4.99% |
| Margin Growth (5Y Trend) ⓘ | -7.11% | -3.86% |
| FCF Growth (5Y CAGR) ⓘ | -28.45% | 4.81% |
| DPS Growth (5Y CAGR) ⓘ | -7.87% | 8.79% |
Quality (Business durability) | ||
| ROIC (Latest) ⓘ | 64.96% | 9.49% |
| ROE (Latest) ⓘ | 57.76% | 13.90% |
| ROA (Latest) ⓘ | 2.25% | 1.55% |
| ROIC (5Y Median) ⓘ | 46.53% | 7.86% |
| ROE (5Y Median) ⓘ | 45.72% | 12.17% |
| ROA (5Y Median) ⓘ | 1.46% | 1.30% |
| Net Debt / EBIT (Latest) ⓘ | -0.83 | 0.96 |
| Net Debt / EBIT (5Y Median) ⓘ | -1.28 | 0.73 |
| Net Debt / EBITDA (Latest) ⓘ | -0.76 | 0.92 |
| Operating Margin (Latest) ⓘ | 29.21% | 22.30% |
| Operating Margin (5Y Median) ⓘ | 29.66% | 24.63% |
| Debt to Equity (Latest) ⓘ | 14.85% | 58.56% |
| Profit Margin (Latest) ⓘ | 23.61% | 26.57% |
| Free Cash Flow (Latest) ⓘ | $487.67M | |
Momentum (Price trend) | ||
| 3Y Return ⓘ | +50.25% | +88.33% |
| 12M Return (excl. last month) ⓘ | +7.67% | +19.38% |
| 6M Return ⓘ | -22.76% | +4.75% |
| Price vs. 200-Day MA ⓘ | -9.69% | +3.50% |
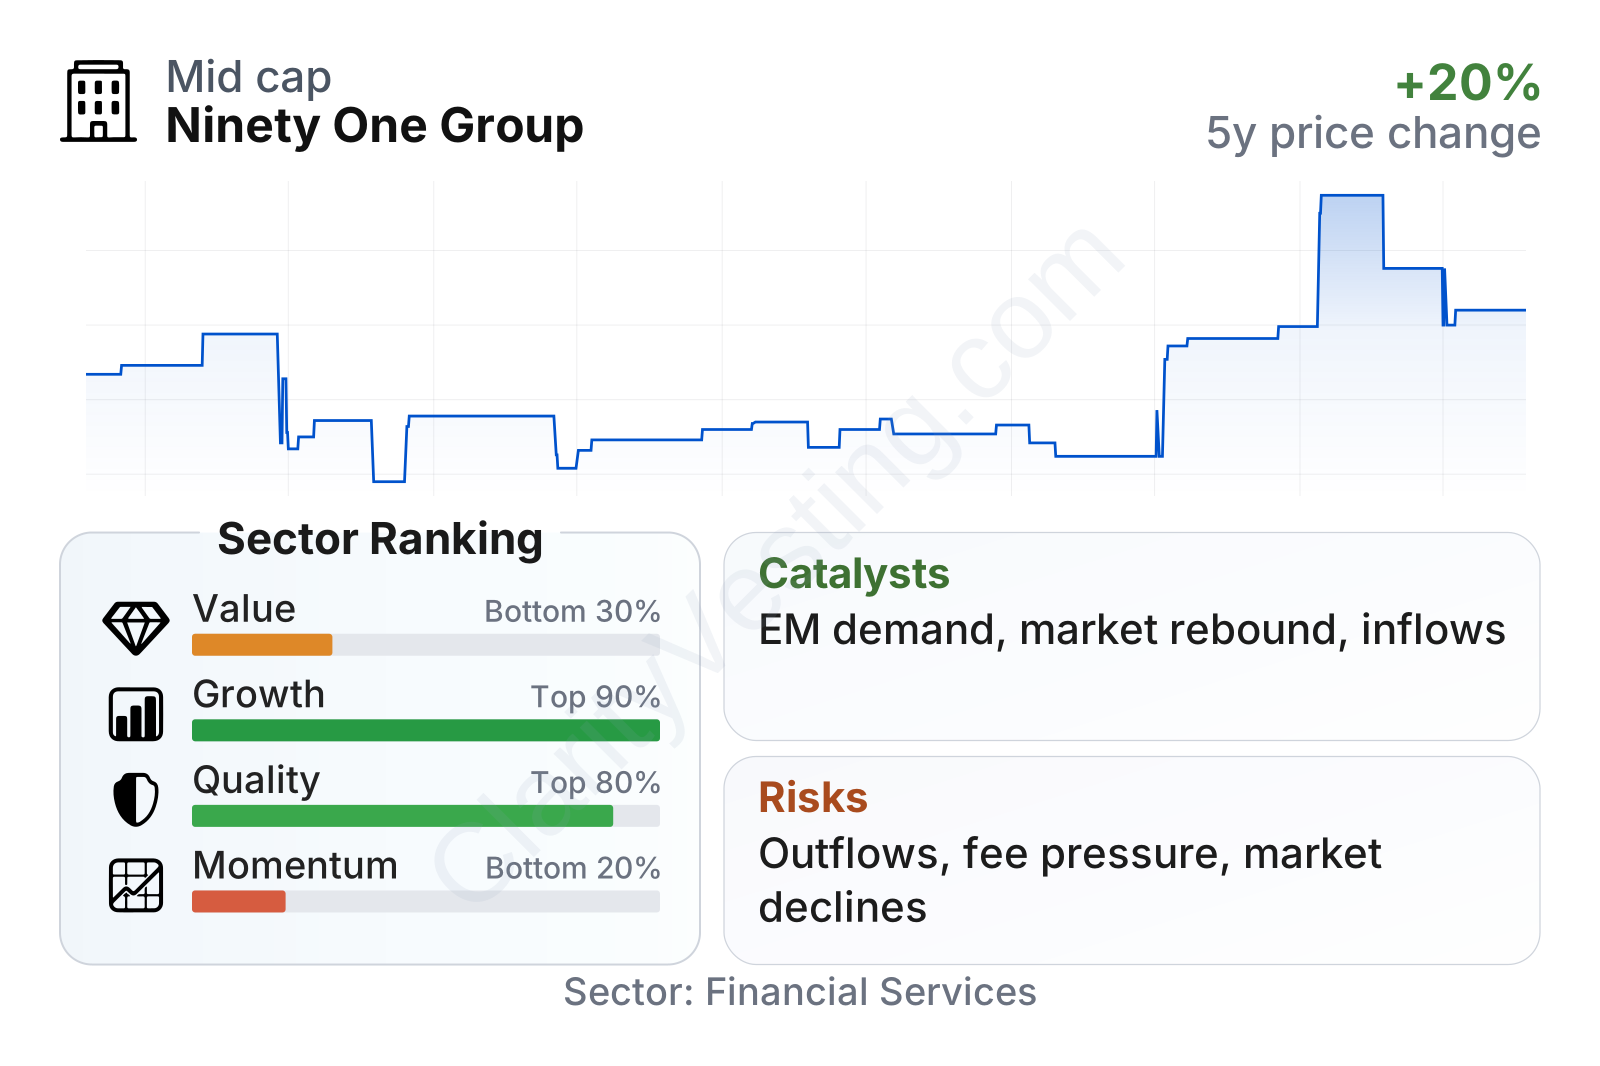
Ninety One is a mid-sized listed asset manager with a relatively low beta, which suggests its shares have historically moved less violently than the broader market. On valuation metrics, the picture is mixed: the earnings multiple is not especially stretched versus the sector median, the dividend yield is above the sector norm, and free cash flow generation looks strong. However, the price-to-book ratio stands far above the sector median, reflecting the market’s willingness to pay a premium for profitability and franchise quality rather than for balance-sheet assets alone.
Profitability is one of the stronger parts of the case. Returns on equity and invested capital are well above typical sector levels, operating margins are also above median, and leverage appears conservative. In fact, the company’s net cash position and modest debt-to-equity ratio indicate a balance sheet that is stronger than many peers in financial services.
Growth indicators are more uneven. Recent year-over-year revenue growth has been healthy, and long-term earnings-per-share growth has been strong, but five-year revenue per share, free cash flow, and dividend growth have been weaker. Market performance has also been soft relative to the sector over the last six months and over multi-year comparisons, which suggests the shares have not fully kept pace with other financial stocks despite the company’s high quality profile.
Growth
Asset management is a mature industry, but it still offers growth where firms have differentiated products, global distribution, and exposure to attractive niches. Ninety One is positioned in areas that can support future expansion, especially emerging markets, global fixed income, multi-asset solutions, and strategies linked to sustainability and energy transition themes. These are segments where institutional clients often look for specialist expertise rather than simply the cheapest provider.
The strategy makes sense because scale in mainstream asset management is difficult to build from scratch, while specialist capabilities can protect pricing and support client retention. Ninety One has spent years building an identity around active management and emerging market investing. That does not make it the global leader in size, but it does make the company more distinctive than a generic fund manager competing only on broad index-like exposure.
Another supportive point is the structure of the business. Asset managers can grow earnings without building factories or carrying large inventories. If assets under management rise through market gains, new mandates, or product expansion, a meaningful share of that growth can flow through to profits. That operating leverage helps explain why earnings growth over five years has been much stronger than the sector median, even though top-line progress has been less consistent.
The recent earnings profile points to resilience rather than explosive expansion. Earnings remain positive, and the broader trend in profitability has held up despite periods of softer markets. For a long-term view, that matters because it shows the franchise can still produce solid results when industry conditions are uneven.
Book value per share has risen steadily over the last five reported years and then moved up sharply in the latest period. That suggests the company has continued to build shareholder equity over time, supported by retained earnings and a disciplined balance sheet. In a financial business, that kind of progression is a useful sign that value creation has not depended only on short-term market enthusiasm.
A realistic catalyst is improved client inflows if investment performance remains competitive and if institutional demand for emerging markets, income strategies, and diversified multi-asset solutions improves. A second catalyst is simple market recovery: when equity and bond markets rise, asset values increase, lifting fee income. The latest annual recovery in revenue also suggests the business entered fiscal 2026 with better operating momentum than it had during the prior down cycle.
Risks
This article is for informational purposes only and does not constitute financial advice. Some content is AI-generated. See Disclaimer


