Stock Analysis · National Healthcare Properties Inc (NHP)
Overview
National Healthcare Properties Inc is a healthcare real estate investment trust, or REIT. In simple terms, it owns healthcare-related properties and earns rent and other property income from the operators using those buildings. Its portfolio is focused on medical facilities tied to patient care, which places the company in the healthcare facilities segment of real estate rather than in drug development, insurance, or hospital operations.
The company’s revenue is primarily generated from leasing healthcare properties. Based on its business model and reporting structure, the main sources of revenue are centered on property income rather than product sales.
- Rental and related property income: the large majority of revenue, likely more than 90%, coming from lease payments and property-level income from healthcare facilities.
- Tenant reimbursements and other real estate income: a smaller share, likely less than 10%, which can include recoveries for property expenses and other contractual payments tied to the owned real estate.
- Other non-core items: a limited contribution from incidental sources such as interest or transaction-related items when applicable.
This is a relatively small public REIT by market value, which matters because smaller property owners can sometimes move faster in niche markets, but they also have less balance sheet flexibility than larger rivals.
The profit flow shows a business with fairly stable revenue over the last four years, staying around the mid-$300 million range, while financing costs remained heavy. Operating results were weak in 2022 through 2024, then turned slightly positive in 2025, suggesting some stabilization at the property level even though bottom-line profitability remained under pressure.
Key Figures
| Metric | Value | Sector ⓘ |
|---|---|---|
| Date | Oct 17, 2026 | |
| Context | ||
| Sector | Real Estate | |
| Industry | REIT - Healthcare Facilities | |
| Market Cap ⓘ | $1.07B | |
| Beta ⓘ | N/A | |
Value (Cheapness) | ||
| P/E Ratio ⓘ | N/A | 17.38 |
| P/B Ratio ⓘ | 0.88 | 0.85 |
| FCF Yield ⓘ | 2.22% | 7.38% |
| Dividend Yield ⓘ | 0.48% | 4.85% |
| EBIT / EV ⓘ | 0.76% | 3.78% |
| PEG ⓘ | N/A | |
Growth (Business expansion) | ||
| Revenue Growth ⓘ | 2.60% | 5.30% |
| RPS Growth (5Y CAGR) ⓘ | 0.57% | 6.02% |
| EPS Growth (5Y CAGR) ⓘ | N/A | -11.37% |
| BVPS Growth (5Y CAGR) ⓘ | -15.52% | 0.45% |
| Margin Growth (5Y Trend) ⓘ | N/A | -0.22% |
| FCF Growth (5Y CAGR) ⓘ | N/A | 5.40% |
| DPS Growth (5Y CAGR) ⓘ | -0.92% | 5.02% |
Quality (Business durability) | ||
| ROIC (Latest) ⓘ | 0.62% | 5.69% |
| ROE (Latest) ⓘ | -5.37% | 7.56% |
| ROA (Latest) ⓘ | -2.42% | 2.85% |
| ROIC (5Y Median) ⓘ | N/A | 4.22% |
| ROE (5Y Median) ⓘ | -9.04% | 6.03% |
| ROA (5Y Median) ⓘ | -3.34% | 2.44% |
| Net Debt / EBIT (Latest) ⓘ | 41.08 | 7.59 |
| Net Debt / EBIT (5Y Median) ⓘ | N/A | 8.40 |
| Net Debt / EBITDA (Latest) ⓘ | 6.56 | 5.27 |
| Net Debt / Assets ⓘ | 28.26% | 37.76% |
| EBITDA / Interest ⓘ | 1.46 | 4.10 |
| Operating Margin (Latest) ⓘ | 3.95% | 35.29% |
| Operating Margin (5Y Median) ⓘ | -4.99% | 37.31% |
| Debt to Equity (Latest) ⓘ | 81.67% | 88.87% |
| Profit Margin (Latest) ⓘ | -13.04% | 19.61% |
| Free Cash Flow (Latest) ⓘ | $23.78M | |
Momentum (Price trend) | ||
| 3Y Return ⓘ | N/A | +30.75% |
| 12M Return (excl. last month) ⓘ | N/A | +4.36% |
| 6M Return ⓘ | N/A | -2.52% |
| Price vs. 200-Day MA ⓘ | N/A | -2.34% |
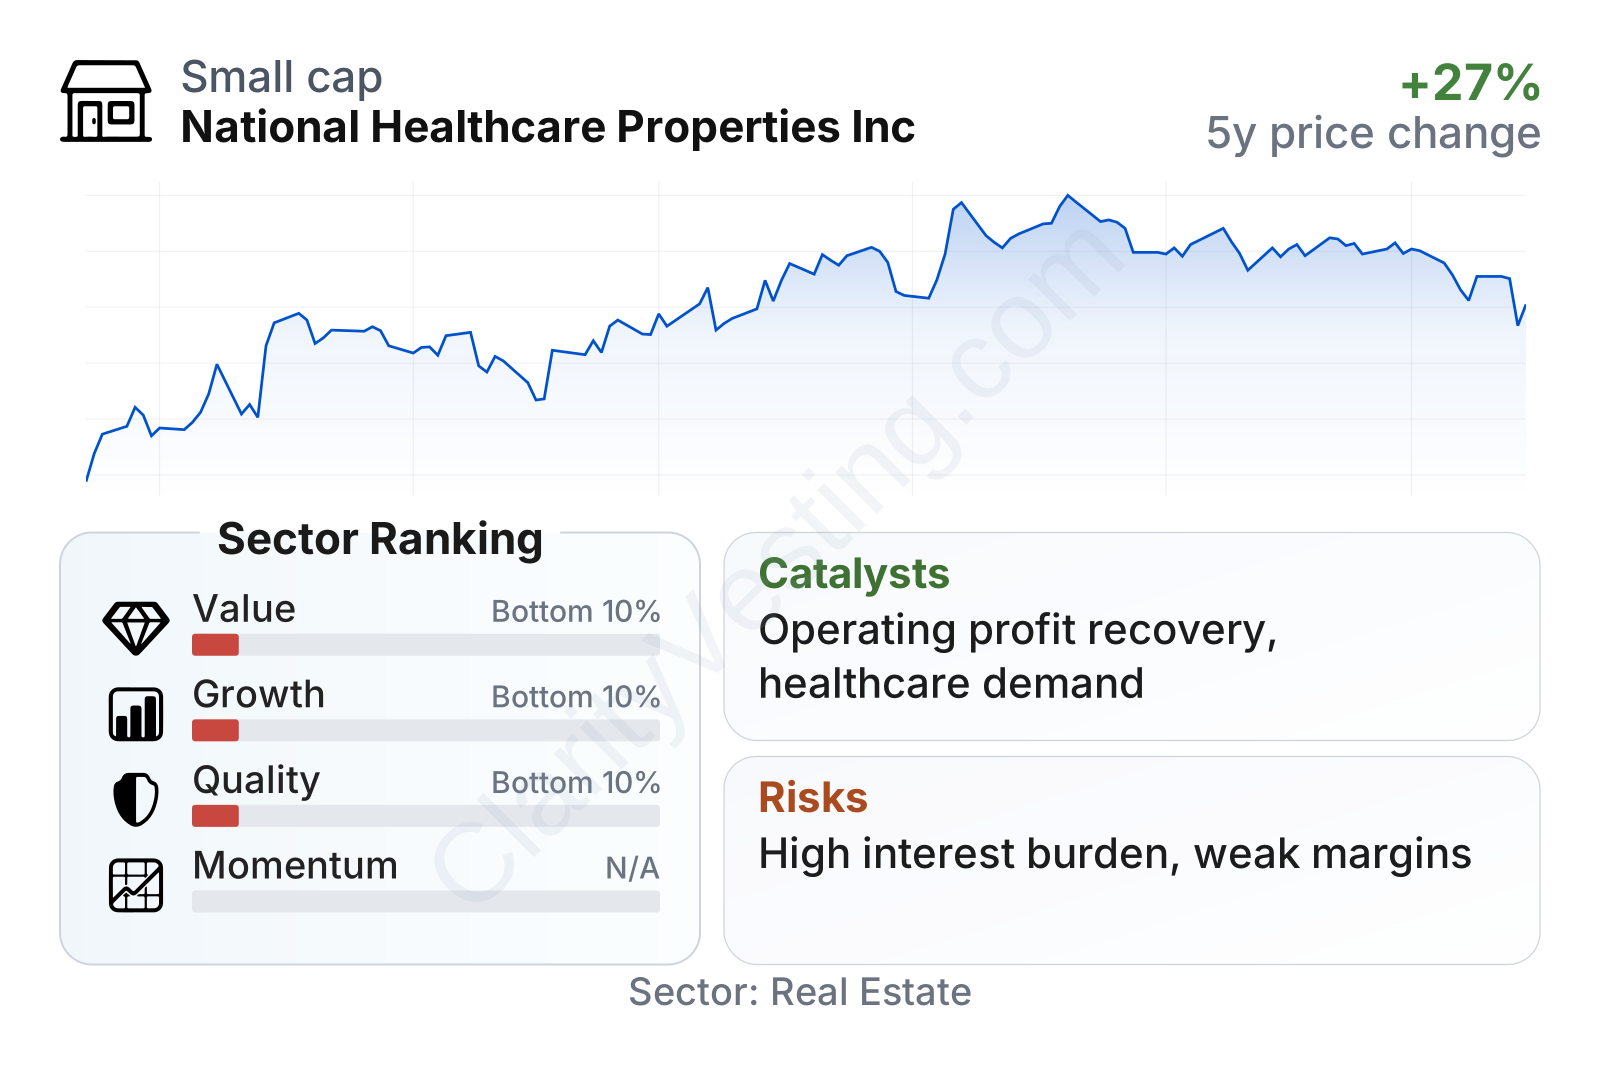
The stock rebounded sharply between late April and late July 2026, but the broader operating profile still looks weak relative to healthcare real estate peers. The company ranks near the bottom of the sector on value, growth, and quality measures, with low cash flow yield, very thin operating profitability, negative returns on equity and assets, and interest coverage that remains tight. Leverage is not extreme when measured against assets, but debt looks heavy compared with current earnings.
Growth
Healthcare real estate is supported by a durable long-term theme: aging populations need more medical services, and that generally supports demand for healthcare facilities over time. That sector backdrop is constructive. For National Healthcare Properties, the more important question is whether it can translate that favorable demand into stronger rent growth, better occupancy, and improved profitability.
The recent operating picture is mixed. Revenue has been relatively steady, and year-over-year growth has remained positive, but it has been modest and below the sector median. That suggests the company is participating in sector demand without clearly outperforming it. The business appears to be in a repair-and-stabilization phase rather than a high-growth phase.
Revenue per share improved from 2022 through 2024 before easing in 2025. That pattern points to a company that managed some top-line progress but has not yet established a consistently rising per-share growth path. For long-term analysis, this matters because per-share progress is what ultimately supports stronger cash generation and balance sheet flexibility.
The dividend per share has been mostly flat, with a slight decline in the latest year. For a REIT, that is an important signal: it suggests management is being cautious and that income growth has not yet fully recovered. On the positive side, a largely maintained payout can also indicate that cash inflows from the property base remain functional despite weak accounting earnings.
A meaningful catalyst would be sustained improvement in operating income after the return to positive operating profit in 2025. If that trend continues, the company could benefit from better coverage of interest expense, more room for capital recycling, and potentially improved market confidence. Another possible opportunity is the continued need for outpatient and community-based medical facilities, an area where healthcare landlords can benefit as care delivery shifts away from more expensive acute-care settings.
Recent public company communications and filings should also be watched for portfolio repositioning, asset sales, refinancing activity, or tenant quality improvements. For a company in this stage, these items can matter as much as headline revenue growth.
Risks
This article is for informational purposes only and does not constitute financial advice. Some content is AI-generated. See Disclaimer


