Stock Analysis · National HealthCare Corporation (NHC)
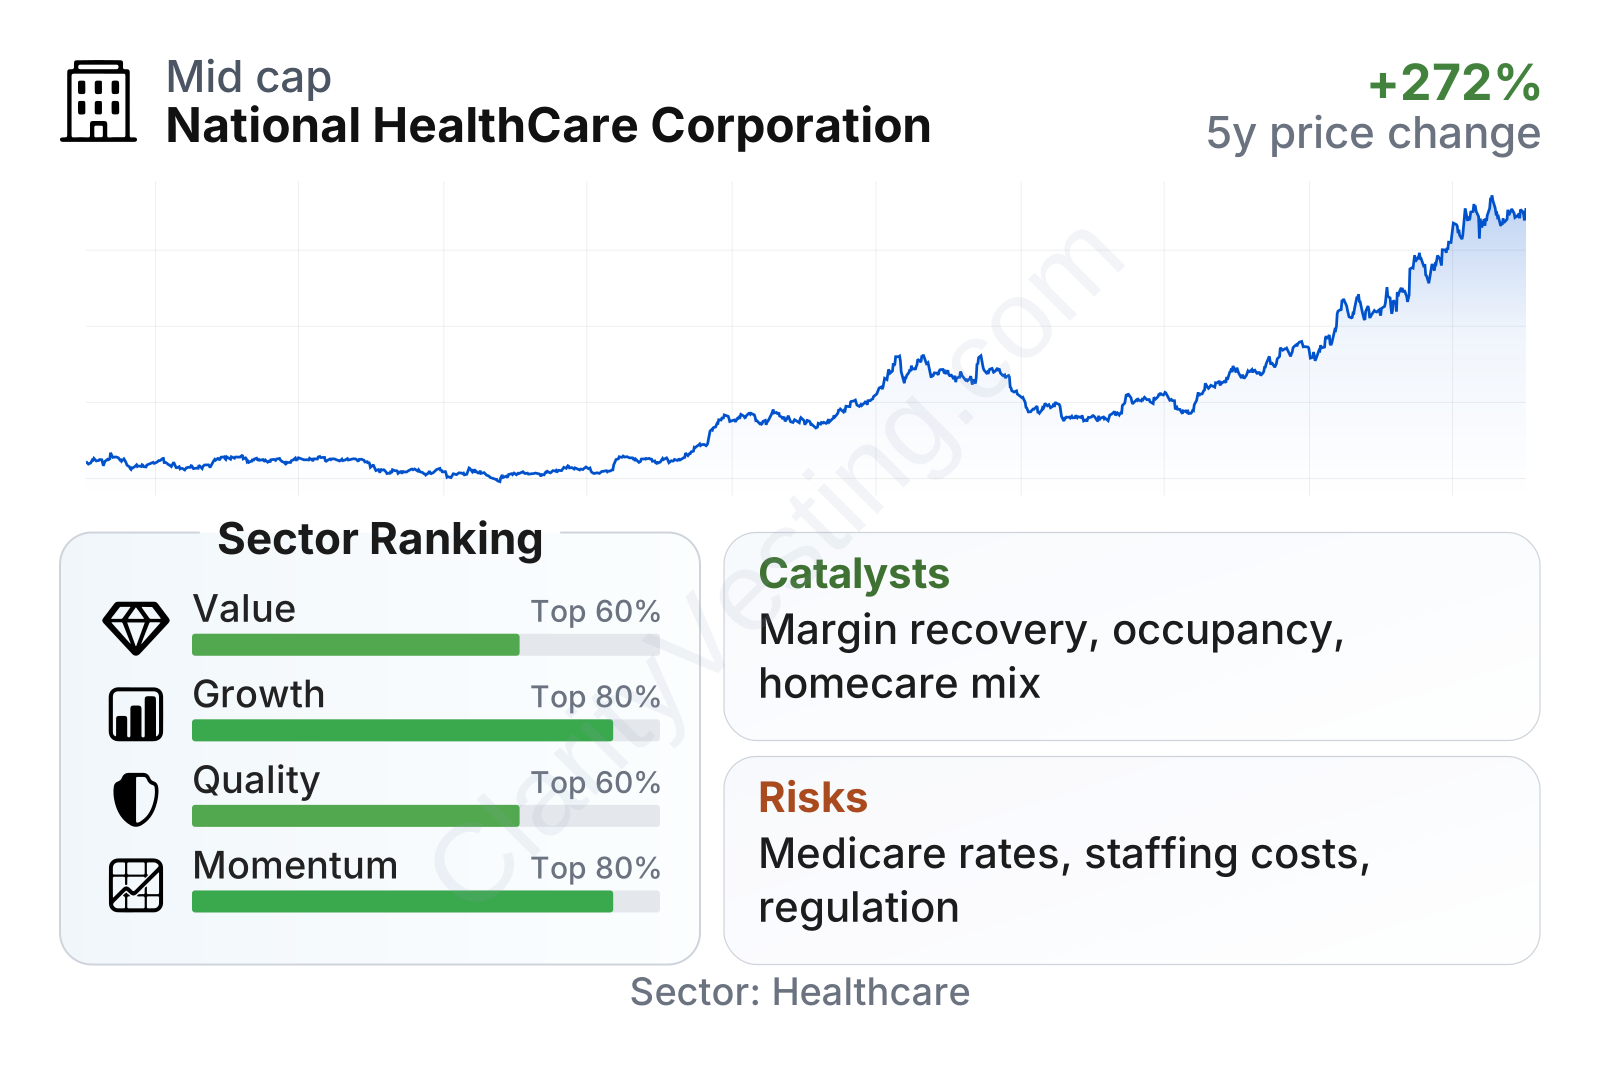
Overview
National HealthCare Corporation is a healthcare services company focused mainly on long-term and post-acute care. It operates skilled nursing facilities, assisted living communities, independent living communities, behavioral health hospitals, and homecare programs including home health, hospice, and therapy services. The company’s footprint is concentrated in the southeastern United States, with Tennessee as its most important state.
Its business is built around caring for older adults and patients who need rehabilitation, nursing supervision, or daily living support after a hospital stay or during chronic health conditions. That makes NHC closely tied to aging demographics, occupancy trends, labor availability, and government reimbursement systems such as Medicare and Medicaid.
Based on recent company disclosures, revenue comes primarily from healthcare services delivered through owned and operated facilities and homecare networks. The mix can shift by year, but the largest sources are generally the nursing center segment and the homecare segment, followed by assisted living and retirement-related services. A practical breakdown is:
- Skilled nursing care and rehabilitation: approximately 60% to 70% of revenue. This includes short-stay rehab, long-term nursing care, and related clinical services delivered in nursing centers.
- Homecare services: approximately 15% to 25% of revenue. This includes home health, hospice, and therapy services provided in patients’ homes.
- Assisted living, independent living, and retirement center services: approximately 10% to 20% of revenue. This covers housing and care support for seniors needing lighter levels of assistance than skilled nursing.
- Other revenue: a small remainder from pharmacy, management relationships, and ancillary healthcare services.
NHC is not one of the largest healthcare facility operators in the country, but it is a meaningful regional operator with a long operating history and a business model centered on service lines that remain essential even during weaker economic periods.
The long-term pattern is constructive: revenue has risen from just above $1.0 billion in 2021 to roughly $1.5 billion in 2025, while profitability has recovered sharply from the pressure seen in 2022. Operating income and net income have both improved materially, suggesting that rising scale has recently been accompanied by better cost absorption rather than revenue growth alone.
Key Figures
| Metric | Value | Sector ⓘ |
|---|---|---|
| Date | Oct 04, 2026 | |
| Context | ||
| Sector | Healthcare | |
| Industry | Medical Care Facilities | |
| Market Cap ⓘ | $3.57B | |
| Beta ⓘ | 0.63 | |
Value (Cheapness) | ||
| P/E Ratio ⓘ | 25.13 | 24.06 |
| P/B Ratio ⓘ | 3.23 | 3.08 |
| FCF Yield ⓘ | 4.11% | 3.08% |
| Dividend Yield ⓘ | 1.16% | 2.05% |
| EBIT / EV ⓘ | 5.62% | 0.63% |
| PEG ⓘ | 0.82 | |
Growth (Business expansion) | ||
| Revenue Growth ⓘ | 8.80% | 7.50% |
| RPS Growth (5Y CAGR) ⓘ | 10.28% | 8.70% |
| EPS Growth (5Y CAGR) ⓘ | 27.84% | -18.20% |
| BVPS Growth (5Y CAGR) ⓘ | 3.94% | 3.95% |
| Margin Growth (5Y Trend) ⓘ | -3.80% | -0.58% |
| FCF Growth (5Y CAGR) ⓘ | 59.45% | 0.88% |
| DPS Growth (5Y CAGR) ⓘ | 4.46% | 6.80% |
Quality (Business durability) | ||
| ROIC (Latest) ⓘ | 13.02% | 3.29% |
| ROA (Latest) ⓘ | 9.02% | 3.02% |
| ROIC (5Y Median) ⓘ | 10.38% | 4.75% |
| ROA (5Y Median) ⓘ | 7.19% | 1.93% |
| Net Debt / EBIT (Latest) ⓘ | -0.10 | 1.33 |
| Net Debt / EBIT (5Y Median) ⓘ | 0.39 | 1.83 |
| Net Debt / EBITDA (Latest) ⓘ | -0.08 | 0.99 |
| Net Debt / Assets ⓘ | -1.28% | 5.33% |
| EBITDA / Interest ⓘ | 91.48 | 9.63 |
| Operating Margin (Latest) ⓘ | 12.05% | 9.25% |
| Operating Margin (5Y Median) ⓘ | 10.83% | 7.80% |
| Debt to Equity (Latest) ⓘ | 2.80% | 28.99% |
| Profit Margin (Latest) ⓘ | 9.00% | 3.60% |
| Free Cash Flow (Latest) ⓘ | $146.53M | |
Momentum (Price trend) | ||
| 3Y Return ⓘ | +270.59% | +36.74% |
| 12M Return (excl. last month) ⓘ | +96.47% | +20.89% |
| 6M Return ⓘ | +40.76% | +9.73% |
| Price vs. 200-Day MA ⓘ | +23.96% | +4.69% |
NHC stands out for financial quality more than for deep value. It is a mid-sized healthcare operator with unusually low balance-sheet risk for its industry, strong returns on capital relative to healthcare peers, and growth metrics that rank well within the sector. The stock has also shown very strong price momentum over the last one to three years. On the other hand, income-oriented metrics are less striking today because the share price appreciation has pushed the dividend yield down to a low level.
Growth
The company operates in a sector with durable long-term demand support. The aging of the U.S. population, longer life expectancy, and ongoing need for rehabilitation and chronic-care services create a structural tailwind for nursing, assisted living, and home-based care. These are not fast-changing technology markets, but they can offer steady demand when operators are disciplined about staffing, reimbursement, and occupancy.
NHC’s strategy appears sensible for that environment. It combines facility-based care with homecare services, giving it exposure to several points along the patient-care path. That matters because healthcare systems increasingly try to place patients in the most cost-effective setting, and home health or hospice can complement skilled nursing rather than compete directly with it. The company also benefits from staying regionally concentrated instead of expanding too aggressively across the country, which can help with local relationships, recruiting, and oversight.
Recent growth has been solid, although not perfectly smooth. Revenue growth turned negative briefly in late 2022, then accelerated through 2023 and especially 2024 and parts of 2025 before moderating again in 2026. Even with that cooling, the latest year-over-year revenue growth remains above the sector median, and the five-year revenue-per-share trend is still favorable. That points to a business that has expanded meaningfully since the post-pandemic disruption period.
Cash generation has strengthened even more clearly than revenue. Free cash flow moved from negative territory in 2022 to well above $100 million on a trailing basis by 2026. That kind of shift often matters more than headline sales growth because it shows the company is converting operations into usable cash after capital spending. In practical terms, stronger free cash flow can support upgrades, acquisitions, dividends, and balance-sheet flexibility.
A notable catalyst is the recovery in margins and earnings after the labor and cost pressures that hurt many care-facility operators earlier in the decade. Another potential driver is continued normalization in occupancy and patient mix, especially if higher-acuity and rehabilitation volumes remain healthy. Company updates in 2026 also indicate continued focus on expanding and improving services across existing markets rather than pursuing risky transformation projects, which fits the company’s conservative operating style.
Risks
This article is for informational purposes only and does not constitute financial advice. Some content is AI-generated. See Disclaimer


