Stock Analysis · National Grid plc (NGGTF)
Overview
National Grid plc is a large regulated utility focused on electricity and natural gas networks. Its role is not to manufacture consumer products or sell software; it owns and operates essential infrastructure that moves power and gas from producers to homes, businesses, and industrial users. The group’s core operations are in the United Kingdom and the northeastern United States, which makes it a cross-Atlantic utility with a business model centered on long-life assets, regulated returns, and heavy capital investment.
For long-term analysis, the most important point is that National Grid earns much of its income from regulated networks. In practice, regulators allow the company to invest in transmission and distribution systems and then recover those costs over time with an approved return, subject to performance standards. That usually creates steadier earnings than more cyclical industries, although it also limits upside and keeps the company closely tied to regulatory decisions.
Based on recent annual reporting, revenue is mainly generated from the following activities:
- UK Electricity Transmission and related system infrastructure: approximately 30% to 35% of group revenue. This includes high-voltage electricity transmission assets and related regulated network activities.
- New York electricity and gas networks: approximately 25% to 30%. These operations distribute electricity and gas to customers in New York under state regulation.
- New England electricity and gas networks: approximately 20% to 25%. This covers regulated utility operations in Massachusetts and surrounding areas where the company serves electric and gas customers.
- UK Electricity Distribution and other regulated activities: a smaller residual share after the group’s past portfolio reshaping, with additional contributions from balancing items and other business lines depending on the reporting period.
The exact mix can shift from year to year because regulated pass-through items, commodity-related recoveries, and asset transactions can materially affect reported revenue. For a utility like National Grid, asset base growth and allowed returns often matter more than headline sales growth.
One visible trend in the financial flow over the last several years is that revenue has been uneven, but operating income has remained relatively resilient. That is consistent with a regulated utility where accounting revenue can move around more than the underlying economics, while margins are supported by regulated returns and cost recovery mechanisms.
Key Figures
| Metric | Value | Sector ⓘ |
|---|---|---|
| Date | Oct 10, 2026 | |
| Context | ||
| Sector | Utilities | |
| Industry | Utilities - Regulated Electric | |
| Market Cap ⓘ | $77.92B | |
| Beta ⓘ | 0.58 | |
Value (Cheapness) | ||
| P/E Ratio ⓘ | 17.61 | 17.09 |
| P/B Ratio ⓘ | 1.92 | 1.51 |
| FCF Yield ⓘ | -7.36% | 0.65% |
| Dividend Yield ⓘ | 3.25% | 3.81% |
| EBIT / EV ⓘ | N/A | 5.01% |
| PEG ⓘ | 1.00 | |
Growth (Business expansion) | ||
| Revenue Growth ⓘ | 2.00% | 6.10% |
| RPS Growth (5Y CAGR) ⓘ | -8.32% | 3.87% |
| EPS Growth (5Y CAGR) ⓘ | -29.53% | -11.58% |
| BVPS Growth (5Y CAGR) ⓘ | 4.70% | 4.29% |
| Margin Growth (5Y Trend) ⓘ | 2.15% | 3.52% |
| FCF Growth (5Y CAGR) ⓘ | N/A | -8.84% |
| DPS Growth (5Y CAGR) ⓘ | 6.44% | 4.84% |
Quality (Business durability) | ||
| ROIC (Latest) ⓘ | N/A | 6.55% |
| ROA (Latest) ⓘ | 5.85% | 3.20% |
| ROIC (5Y Median) ⓘ | 6.57% | 5.98% |
| ROA (5Y Median) ⓘ | 2.90% | 2.75% |
| Net Debt / EBIT (Latest) ⓘ | 4.67 | 6.90 |
| Net Debt / EBIT (5Y Median) ⓘ | 9.60 | 7.23 |
| Net Debt / EBITDA (Latest) ⓘ | 3.24 | 4.32 |
| Net Debt / Assets ⓘ | 42.83% | 38.42% |
| EBITDA / Interest ⓘ | 5.45 | 4.47 |
| Operating Margin (Latest) ⓘ | 27.60% | 20.99% |
| Operating Margin (5Y Median) ⓘ | 25.18% | 20.08% |
| Debt to Equity (Latest) ⓘ | 118.97% | 138.21% |
| Profit Margin (Latest) ⓘ | 18.32% | 11.37% |
| Free Cash Flow (Latest) ⓘ | -$5.73B | |
Momentum (Price trend) | ||
| 3Y Return ⓘ | +53.10% | +52.56% |
| 12M Return (excl. last month) ⓘ | +17.80% | +11.56% |
| 6M Return ⓘ | -8.93% | -3.04% |
| Price vs. 200-Day MA ⓘ | -6.40% | -1.11% |
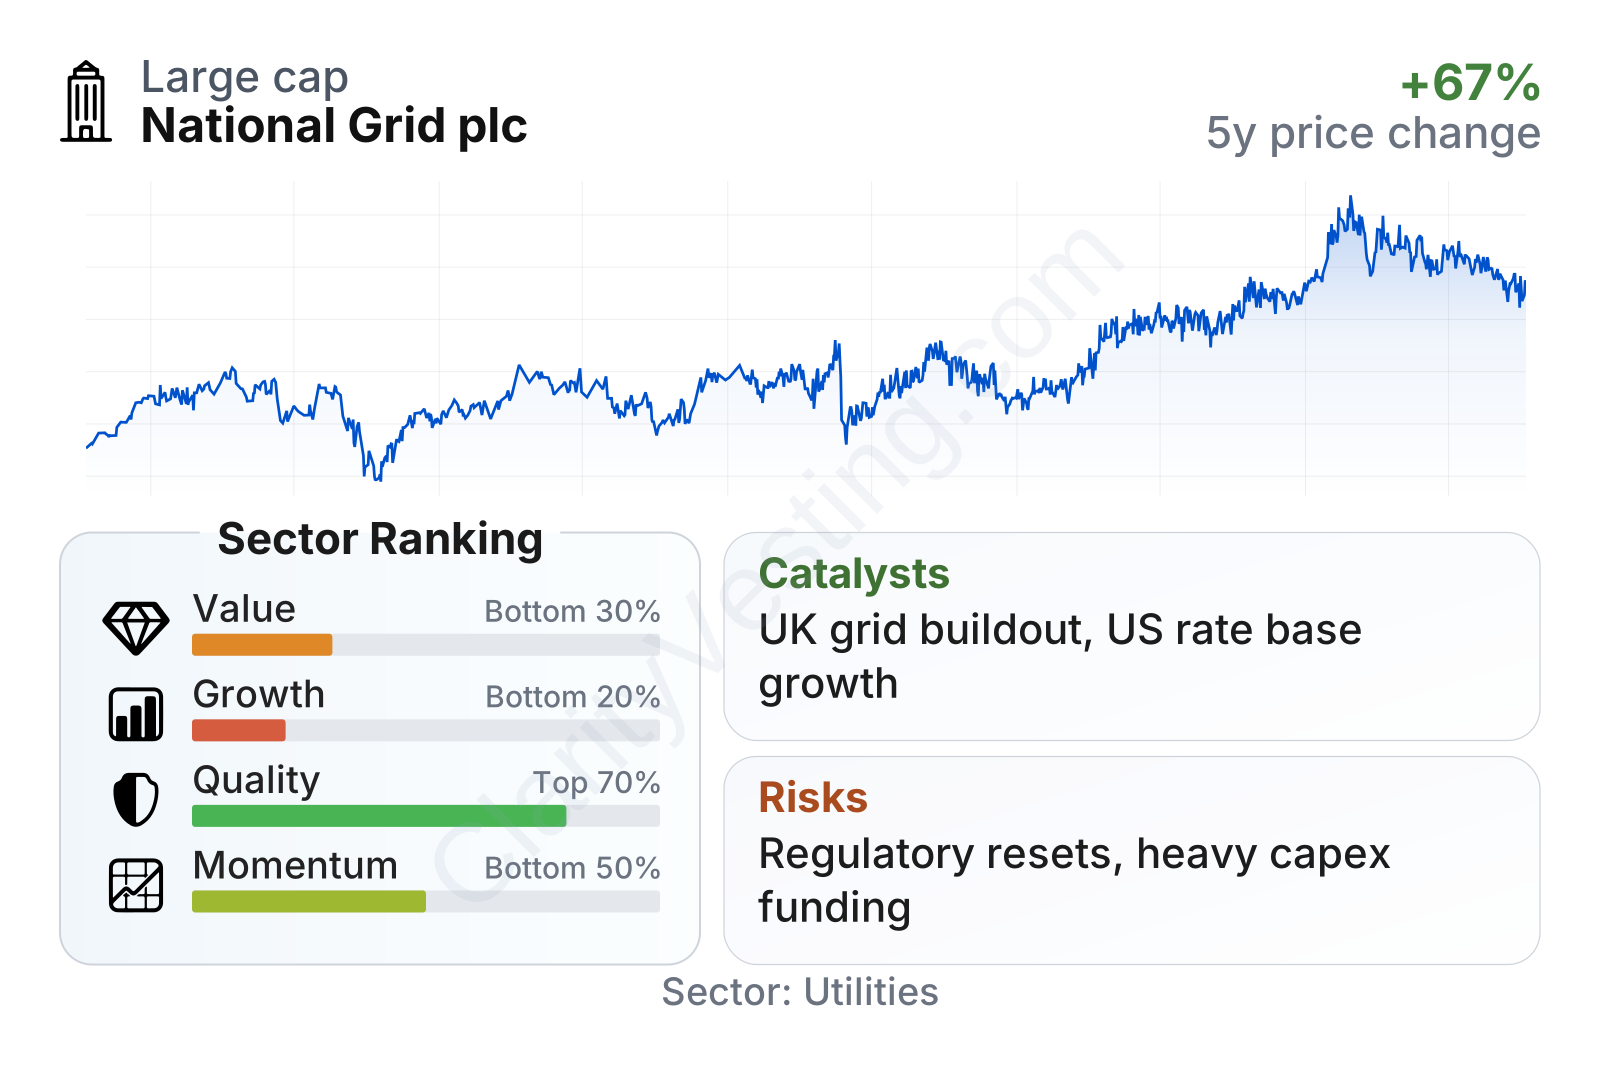
National Grid is a very large utility with relatively low share-price volatility, reflected by a beta well below 1. In plain terms, the stock has generally moved less dramatically than the broader market. The quality profile is stronger than much of the utility sector: operating margin and profit margin are above sector medians, return on assets is also stronger, and interest coverage looks solid for a capital-intensive business.
The weaker area is growth. Revenue growth has been modest, and the longer-term revenue-per-share and earnings-per-share trends have been pressured. That partly reflects portfolio changes, share count effects, and the fact that utilities often grow through regulated asset expansion rather than rapid sales increases. On valuation, the shares do not screen as especially cheap relative to the sector, while free cash flow is currently negative because the company is investing heavily.
Growth
National Grid operates in a sector with durable long-term demand. Electricity networks are becoming more important as economies electrify transport, heating, and industry, while power systems also need major upgrades to connect renewable generation, data centers, storage, and grid-balancing assets. That creates a favorable backdrop for transmission and distribution owners, especially those already controlling strategic infrastructure in densely populated regions.
The company’s strategy broadly fits that trend. National Grid has been concentrating on regulated network businesses rather than more volatile or non-core activities. That matters because regulated expansion can produce visible multi-year investment pipelines, with future earnings linked to growth in the regulated asset base instead of short-lived commodity swings.
Recent company communications have emphasized large capital expenditure plans in both the UK and the US, especially around electricity transmission. This is an important catalyst because grid expansion is increasingly treated as a national infrastructure priority. In the UK, the push to connect more offshore wind and strengthen the transmission backbone supports future investment needs. In the US, aging networks, electrification, and reliability spending create similar opportunities.
That said, the revenue-per-share trend has moved down over the past five years, so the growth case should not be framed as a simple sales expansion story. The more relevant question is whether today’s spending creates a larger regulated asset base and stronger allowed earnings later. For National Grid, that is the central path to growth. Another positive sign is dividend-per-share growth over five years that has run ahead of the sector median, suggesting management has kept shareholder distributions progressing even during a period of portfolio change and elevated investment.
A further support for the long-term outlook is the essential nature of the assets. Building new transmission lines and replacing old infrastructure typically requires large capital, technical expertise, permits, and long development timelines. Those barriers make it hard for new entrants to challenge incumbent grid operators in their existing territories.
Risks
This article is for informational purposes only and does not constitute financial advice. Some content is AI-generated. See Disclaimer


