Stock Analysis · Newmont Goldcorp Corp (NEM)
Overview
Newmont Goldcorp Corp, usually referred to as Newmont, is one of the world’s largest gold mining companies. It explores for mineral deposits, develops mines, extracts ore, and processes it into sellable metals. Its operations are spread across major mining regions including North America, South America, Australia, and Africa. The company’s scale matters because mining is capital-intensive, operationally complex, and heavily influenced by commodity prices, so larger producers often have better access to financing, broader mine portfolios, and more room to shift capital between projects.
Revenue is driven mainly by metal sales, with gold by far the largest contributor. Based on Newmont’s recent annual reporting mix, the company’s revenue sources can be summarized approximately as follows:
- Gold: about 85% to 90% — the core business, coming from doré bars and concentrate produced at the company’s gold mines.
- Copper: about 8% to 12% — produced as a primary metal at some assets and as a by-product at others; this is strategically important because copper is tied to electrification and grid investment.
- Silver, lead, zinc, and other metals: about 2% to 5% — smaller by-product streams that help offset costs at certain operations.
Newmont’s business model is relatively simple to understand: it sells commodities whose prices are set globally, while trying to control costs, extend mine life through exploration, and improve returns through disciplined project selection. Over the last few years, its earnings profile has been volatile, but more recent results show a sharp recovery in revenue, operating income, and net income as production mix and metal prices improved.
The company’s cost structure has also become more favorable recently. Revenue has expanded strongly since 2023, while operating expenses outside production costs have remained comparatively contained. That operating leverage is important in mining because when gold prices rise and execution is steady, profit can increase much faster than revenue.
The recent picture shows a much stronger conversion from revenue into operating profit and net income than in the weaker 2022–2023 period, when margins were pressured and profitability turned negative. That swing highlights both the upside and the cyclicality built into the business.
Key Figures
| Metric | Value | Sector ⓘ |
|---|---|---|
| Date | Oct 10, 2026 | |
| Context | ||
| Sector | Basic Materials | |
| Industry | Gold | |
| Market Cap ⓘ | $119.64B | |
| Beta ⓘ | 0.53 | |
Value (Cheapness) | ||
| P/E Ratio ⓘ | 14.32 | 17.36 |
| P/B Ratio ⓘ | 3.44 | 1.73 |
| FCF Yield ⓘ | 10.67% | 5.81% |
| Dividend Yield ⓘ | 0.88% | 1.98% |
| EBIT / EV ⓘ | 9.04% | 6.34% |
| PEG ⓘ | 2.83 | |
Growth (Business expansion) | ||
| Revenue Growth ⓘ | 15.10% | 11.15% |
| RPS Growth (5Y CAGR) ⓘ | 6.99% | 4.49% |
| EPS Growth (5Y CAGR) ⓘ | 30.19% | -12.80% |
| BVPS Growth (5Y CAGR) ⓘ | 2.31% | 5.49% |
| Margin Growth (5Y Trend) ⓘ | 43.32% | -1.54% |
| FCF Growth (5Y CAGR) ⓘ | 29.12% | 0.20% |
| DPS Growth (5Y CAGR) ⓘ | -17.87% | 5.91% |
Quality (Business durability) | ||
| ROIC (Latest) ⓘ | 18.30% | 9.26% |
| ROA (Latest) ⓘ | 15.31% | 4.92% |
| ROIC (5Y Median) ⓘ | 0.67% | 7.82% |
| ROA (5Y Median) ⓘ | 2.85% | 3.88% |
| Net Debt / EBIT (Latest) ⓘ | -0.30 | 1.37 |
| Net Debt / EBIT (5Y Median) ⓘ | 1.02 | 1.70 |
| Net Debt / EBITDA (Latest) ⓘ | -0.25 | 0.92 |
| Net Debt / Assets ⓘ | -6.15% | 13.56% |
| EBITDA / Interest ⓘ | 90.77 | 12.28 |
| Operating Margin (Latest) ⓘ | 52.31% | 13.20% |
| Operating Margin (5Y Median) ⓘ | 11.27% | 11.82% |
| Debt to Equity (Latest) ⓘ | 15.43% | 39.91% |
| Profit Margin (Latest) ⓘ | 33.36% | 6.43% |
| Free Cash Flow (Latest) ⓘ | $12.77B | |
Momentum (Price trend) | ||
| 3Y Return ⓘ | +218.27% | +68.93% |
| 12M Return (excl. last month) ⓘ | +69.74% | +36.53% |
| 6M Return ⓘ | -0.53% | 0.00% |
| Price vs. 200-Day MA ⓘ | +1.97% | -0.18% |
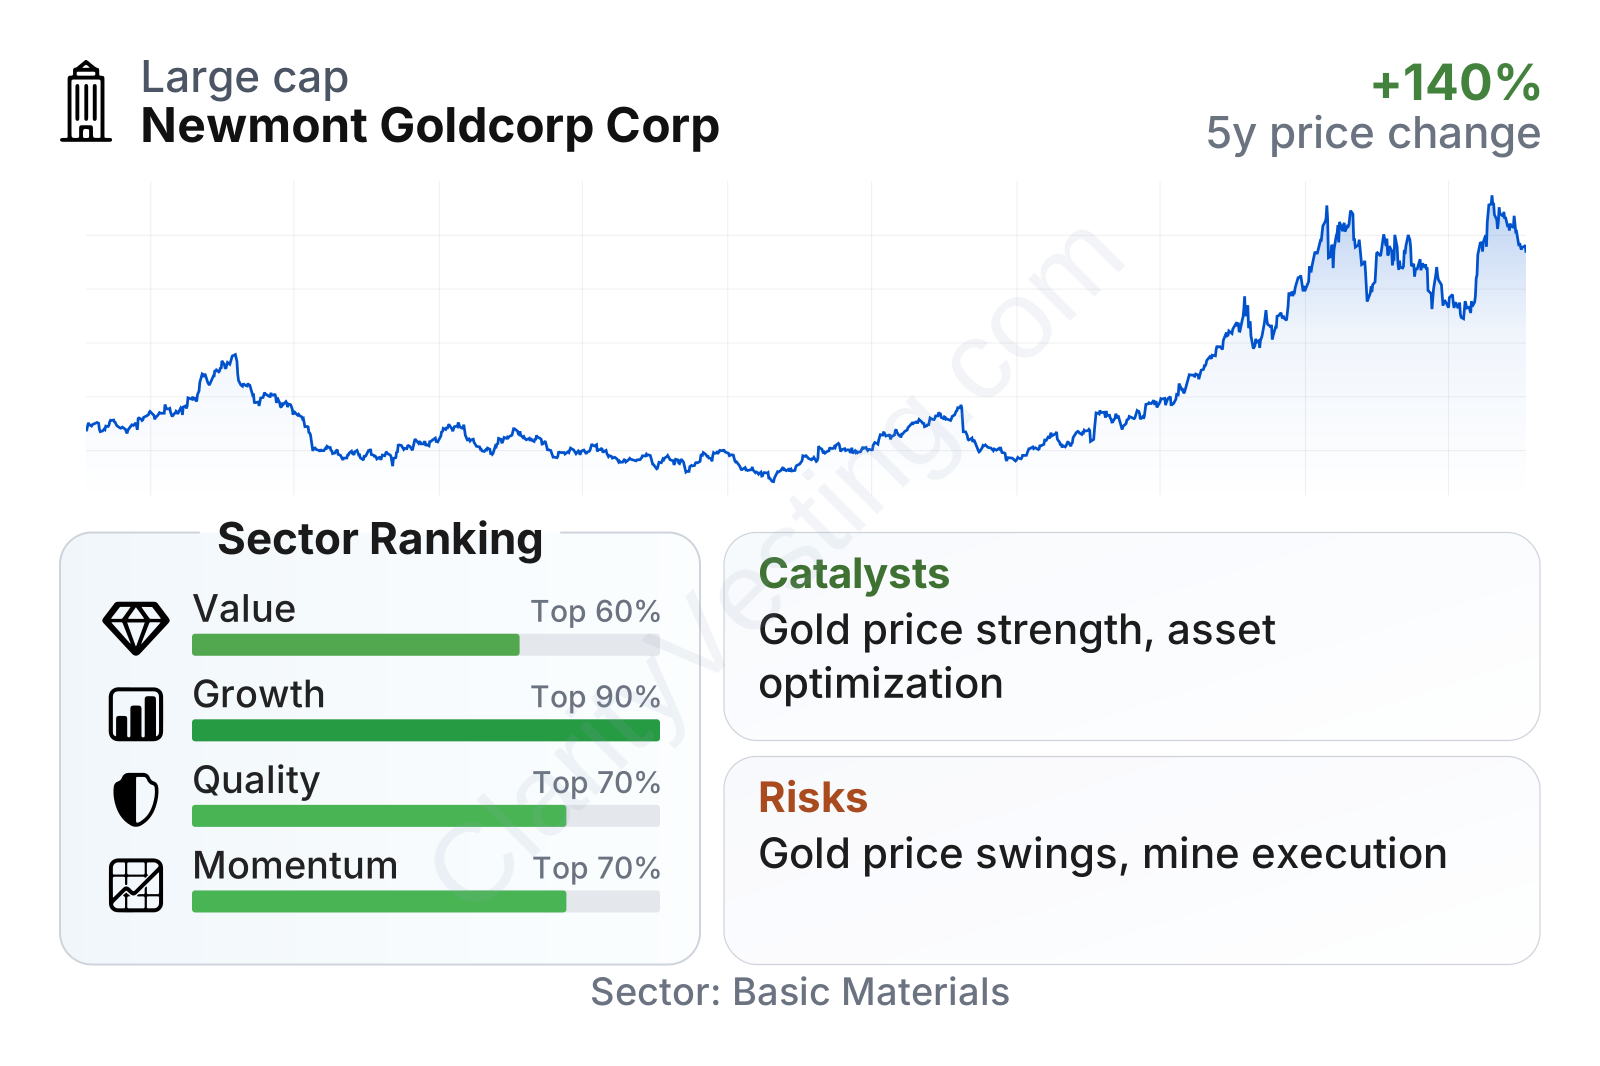
Newmont is a very large company within the gold industry, and its recent metrics show a business that currently ranks well on growth, quality, and market performance relative to much of the broader materials sector. Valuation is not stretched on earnings and cash flow measures, although the price-to-book ratio is noticeably higher than the sector median, which suggests the market is assigning a premium to asset quality, balance sheet strength, or earnings durability. The dividend yield is modest at under 1%, so the current investment case is tied more to operating performance and commodity exposure than to income.
Another notable point is financial resilience. Debt levels are low relative to equity, and net debt metrics are unusually strong, with cash effectively exceeding debt on some measures. Combined with high interest coverage and strong free cash flow generation, this leaves the company in a much better position than many miners to absorb volatility or fund projects internally.
Growth
Gold mining is not a classic high-growth industry in the same way as software or semiconductors, but it remains highly relevant for long-term capital allocation because gold plays several roles at once: a store of value, a reserve asset for central banks, and a hedge during periods of inflation, currency weakness, or geopolitical stress. Those structural supports have kept investor and central bank demand elevated. At the same time, large high-quality gold deposits are becoming harder and more expensive to replace, which can benefit established producers that already control long-life assets.
Newmont’s strategy for growth is based less on chasing volume at any cost and more on upgrading the portfolio. In recent company communications, management has emphasized concentrating capital on higher-quality operations, divesting non-core assets, improving efficiency, and prioritizing returns. That approach makes sense in mining, where poor acquisitions and overbuilding have historically destroyed value across the sector.
Revenue growth has been strong over the last several reported periods, although not perfectly smooth. The broader trend shows a major rebound after the weak stretch in 2022 and 2023. That pattern is typical for miners: production timing, asset sales, grade changes, and metal prices can all cause quarterly swings. Even so, the recent growth profile stands above the sector median, which suggests Newmont has participated meaningfully in the favorable part of the gold cycle.
Free cash flow is one of the most encouraging parts of the current profile. After a soft period, cash generation accelerated sharply and now sits at a very high level in absolute terms. For a mining company, this matters because free cash flow can fund mine development, support dividends, reduce debt, and create flexibility if gold prices weaken later. Strong free cash flow also reduces the need to rely on equity issuance or additional borrowing.
A key catalyst is Newmont’s exposure to elevated gold prices. Because many mining costs do not move up as quickly as the gold price, a stronger pricing environment can significantly expand margins and cash flow. Another catalyst is portfolio optimization following major asset integration and rationalization efforts. If the company continues to sell lower-priority assets and focus on its best mines, the quality of earnings could improve even if total production does not rise dramatically.
Copper also adds an extra growth angle. While still much smaller than gold in revenue contribution, copper links Newmont to electrification, power infrastructure, and industrial demand. That gives the company some diversification beyond precious metals and potentially improves long-term strategic relevance.
Risks
This article is for informational purposes only and does not constitute financial advice. Some content is AI-generated. See Disclaimer